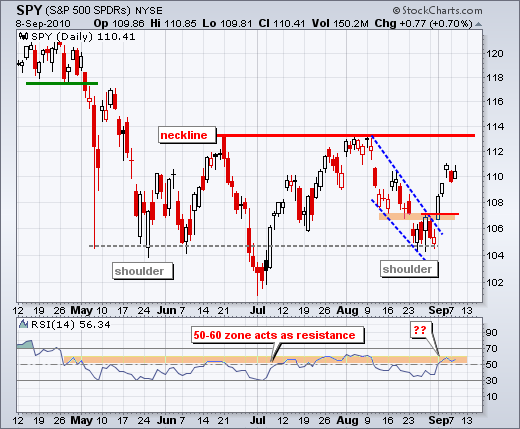
For short-term traders, SPY is currently caught between a rock and a hard place. The swing is clearly up after last week's breakout, but the ETF became overbought with Friday's close above 111. Also note that the ETF remains in a large trading range that extends back to May and RSI is in a resistance zone (50-60). While I think there will be another push to resistance around 113, we could see a pullback or an extended consolidation before this push. On the daily chart, broken resistance around 107 turns into support. A move below this level would negate the breakout and call for a reassessment.

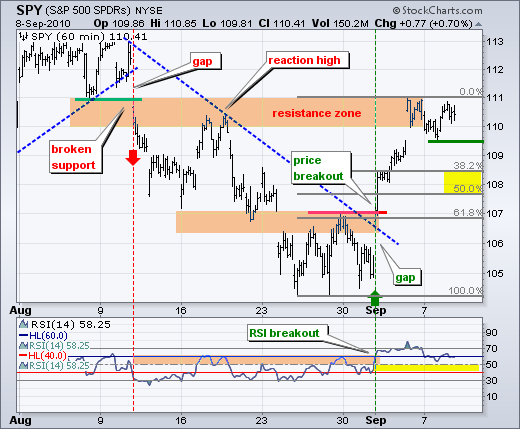
On the 60-minute chart, SPY continues to stall in the 110-111 resistance zone. With a reaction low on Tuesday, the ETF established the first short-term support level to watch. A break below Tuesday's low would call for a deeper pullback towards the 108 area. This is the first place I would expect support. I would also expect RSI to find support in the 40-50 zone. As long as SPY holds above Tuesday's low, we could see some flat trading and then another push higher.
Key Economic Reports:
Wed - Sep 08 - 15:00 - Consumer Credit
Thu - Sep 09 - 08:30 - Initial Claims
Thu - Sep 09 - 10:00 - 30 Year Bond Auction
Charts of Interest: SMH, XLK, FXE, TLT, $TNX, USO
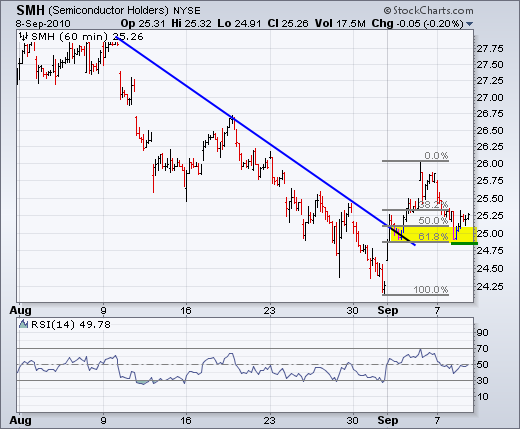
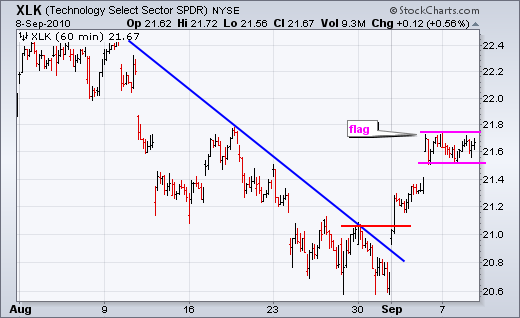
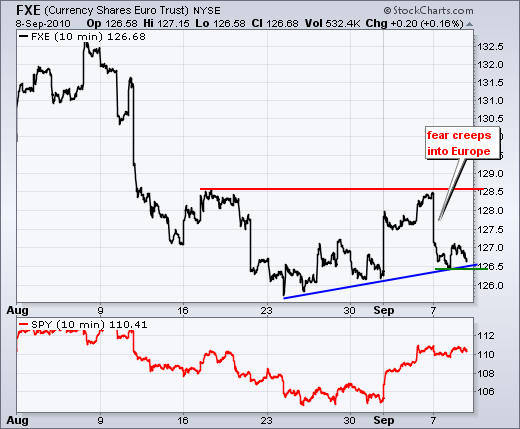
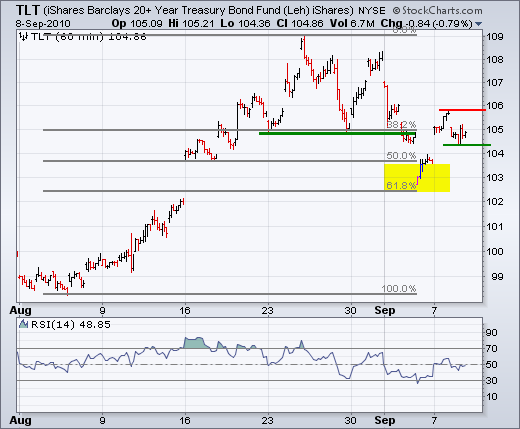
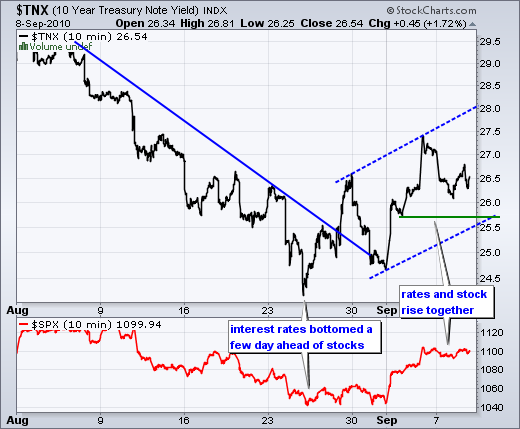
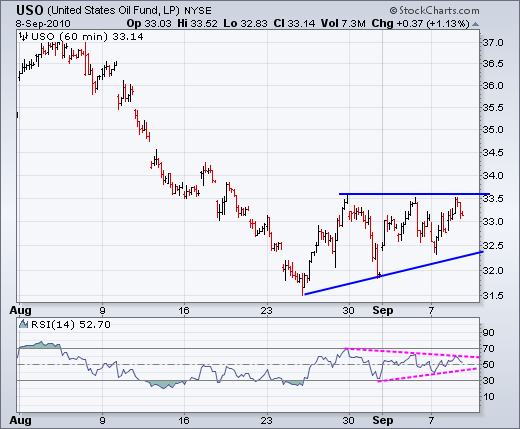
Instead of individual stock charts, I am showing some ETF charts today. The Semiconductors HOLDRS (SMH) is testing an important support level marked by the 62% retracement. Relative weakness in semis has been a negative for the market recently. The Technology SPDR (XLK) has a bull flag working. The direction of the breakout will trigger the next short-term signal. Watch those semis. The Euro ETF (FXE) looks quite vulnerable after Tuesday's sharp decline. This is a concern because the Euro and stock market have been positive correlated in 2010. The 20+ Year T-Bond ETF (TLT) is meeting resistance near broken support. Bonds move opposite of stocks. The US Oil Fund ETF (USO) formed an ascending triangle and would likely break resistance if stocks continue higher.
This commentary and charts-of-interest are designed to stimulate thinking. This analysis is not a recommendation to buy, sell, hold or sell short any security (stock ETF or otherwise). We all need to think for ourselves when it comes to trading our own accounts. First, it is the only way to really learn. Second, we are the only ones responsible for our decisions. Think of these charts as food for further analysis. Before making a trade, it is important to have a plan. Plan the trade and trade the plan. Among other things, this includes setting a trigger level, a target area and a stop-loss level. It is also important to plan for three possible price movements: advance, decline or sideways. Have a plan for all three scenarios BEFORE making the trade. Consider possible holding times. And finally, look at overall market conditions and sector/industry performance.

About the author:
Arthur Hill, CMT, is the Chief Technical Strategist at TrendInvestorPro.com. Focusing predominantly on US equities and ETFs, his systematic approach of identifying trend, finding signals within the trend, and setting key price levels has made him an esteemed market technician. Arthur has written articles for numerous financial publications including Barrons and Stocks & Commodities Magazine. In addition to his Chartered Market Technician (CMT) designation, he holds an MBA from the Cass Business School at City University in London.
Learn More