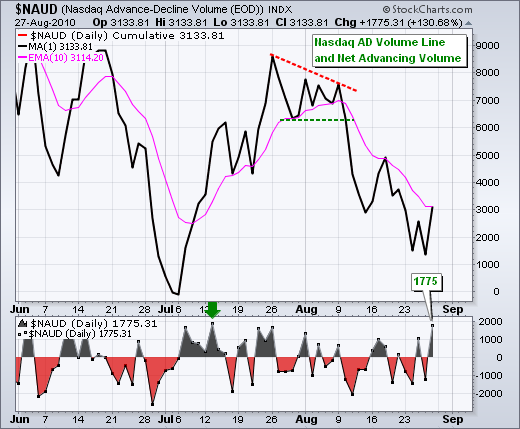
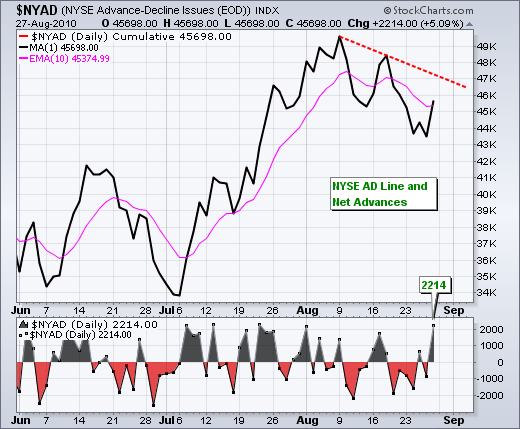
After a rather volatile first hour on Friday, stocks found their footing and moved steadily higher throughout the day. Friday's action produced a few positives as we move into an important week. First, stocks managed to overcome early weakness. SPY moved below 104.5 in the first 40 minutes, but rebounded sharply with a move above 105.75 by 10:40AM ET. Second, stocks build on this recovery with a steady advance into the close. In fact, there were two days or buying pressure last week as stocks moved steadily higher after a weak open on Tuesday as well. Third, breadth was strong on the Nasdaq and NYSE. The first chart shows the Nasdaq AD Volume Line surging to its highest level since 13-July. NYSE Net Advances surged to their highest level since 22-July. Friday's advance was the strongest in over a month.


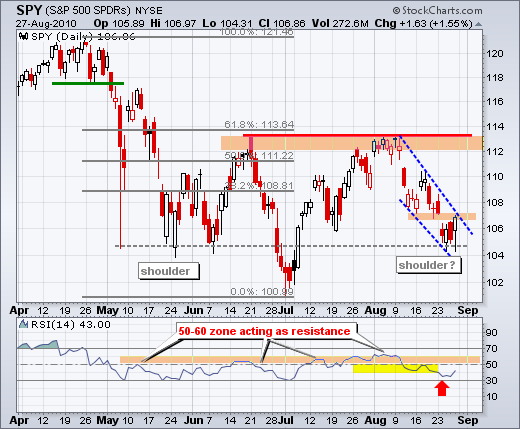
On the daily chart, it is possible that SPY is in the early stages of forming the right shoulder of an inverse head-and-shoulders pattern. "Early" is the key word here. A falling channel has taken shape the last three weeks with a sharp decline. SPY was clearly oversold early this week and ripe for an oversold bounce or consolidation. I was impressed with Friday's price action and breadth, but would like to see follow through with similar breadth before considering the support test around 105 successful. Also note that SPY has yet to fill the gap around 107.

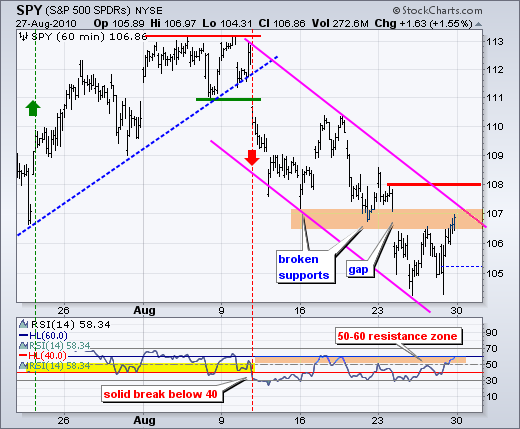
The 60-minute chart focuses on the falling channel and resistance around 107. Resistance here is confirmed by the mid August trendline broken support and last week's gap. Also notice that RSI advanced to 58.34 (just below 60). The 50-60 zone marks momentum resistance in a downtrend. Also note that a trendline breakout would likely coincide with an RSI break above 60. These would be positive developments, but I am holding out for a break above key resistance at 108 before considering the trend reversal valid.

It is one full week on the economic reporting front. The fireworks start on Tuesday with the Chicago PMI, Consumer Confidence and FOMC minutes. Consensus for Chicago PMI is 56. Anything below 55 would be negative. Wednesday features the ISM Manufacturing Index. Consensus is 53 and anything less would be negative. The market could be hit hard if either or both fall below 50, which would favor economic contraction. I do not expect that though. The European Central Bank makes its interest rate decision and policy statement on Thursday, which will affect the Euro. Friday is the big day with ISM Services (consensus 53) and non-farm payrolls (consensus -80,000). We can basically watch the trend for these reports as the week unfolds. Better-than-expected numbers could buoy the bulls, but worse-than-expected numbers would likely bring out the sellers as chances of a double dip increase.
Key Economic Reports:
Mon - Aug 30 - 08:30 - Personal Income and Spending
Tue - Aug 31 - 09:00 - Case-Shiller Housing Price Index
Tue - Aug 31 - 09:45 - Chicago PMI
Tue - Aug 31 - 10:00 - Consumer Confidence
Tue - Aug 31 - 14:00 - FOMC Meeting Minutes
Wed - Sep 01 - 08:15 - ADP Employment Report
Wed - Sep 01 - 10:00 - Construction Spending
Wed - Sep 01 - 10:00 - ISM Index
Wed - Sep 01 - 10:30 - Oil Inventories
Wed - Sep 01 - 14:00 - Auto-Truck Sales
Thu - Sep 02 - 07:45 - European Central Bank Policy Statement
Thu - Sep 02 - 08:30 - Initial Claims
Thu - Sep 02 - 10:00 - Factory Orders
Thu - Sep 02 - 10:00 - Pending Home Sales
Fri - Sep 03 - 08:30 - Employment Report
Fri - Sep 03 - 10:00 - ISM Services
Charts of Interest: Tuesday and Thursday
This commentary and charts-of-interest are designed to stimulate thinking. This analysis is not a recommendation to buy, sell, hold or sell short any security (stock ETF or otherwise). We all need to think for ourselves when it comes to trading our own accounts. First, it is the only way to really learn. Second, we are the only ones responsible for our decisions. Think of these charts as food for further analysis. Before making a trade, it is important to have a plan. Plan the trade and trade the plan. Among other things, this includes setting a trigger level, a target area and a stop-loss level. It is also important to plan for three possible price movements: advance, decline or sideways. Have a plan for all three scenarios BEFORE making the trade. Consider possible holding times. And finally, look at overall market conditions and sector/industry performance.

The 60-minute chart focuses on the falling channel and resistance around 107. Resistance here is confirmed by the mid August trendline broken support and last week's gap. Also notice that RSI advanced to 58.34 (just below 60). The 50-60 zone marks momentum resistance in a downtrend. Also note that a trendline breakout would likely coincide with an RSI break above 60. These would be positive developments, but I am holding out for a break above key resistance at 108 before considering the trend reversal valid.

It is one full week on the economic reporting front. The fireworks start on Tuesday with the Chicago PMI, Consumer Confidence and FOMC minutes. Consensus for Chicago PMI is 56. Anything below 55 would be negative. Wednesday features the ISM Manufacturing Index. Consensus is 53 and anything less would be negative. The market could be hit hard if either or both fall below 50, which would favor economic contraction. I do not expect that though. The European Central Bank makes its interest rate decision and policy statement on Thursday, which will affect the Euro. Friday is the big day with ISM Services (consensus 53) and non-farm payrolls (consensus -80,000). We can basically watch the trend for these reports as the week unfolds. Better-than-expected numbers could buoy the bulls, but worse-than-expected numbers would likely bring out the sellers as chances of a double dip increase.
Key Economic Reports:
Mon - Aug 30 - 08:30 - Personal Income and Spending
Tue - Aug 31 - 09:00 - Case-Shiller Housing Price Index
Tue - Aug 31 - 09:45 - Chicago PMI
Tue - Aug 31 - 10:00 - Consumer Confidence
Tue - Aug 31 - 14:00 - FOMC Meeting Minutes
Wed - Sep 01 - 08:15 - ADP Employment Report
Wed - Sep 01 - 10:00 - Construction Spending
Wed - Sep 01 - 10:00 - ISM Index
Wed - Sep 01 - 10:30 - Oil Inventories
Wed - Sep 01 - 14:00 - Auto-Truck Sales
Thu - Sep 02 - 07:45 - European Central Bank Policy Statement
Thu - Sep 02 - 08:30 - Initial Claims
Thu - Sep 02 - 10:00 - Factory Orders
Thu - Sep 02 - 10:00 - Pending Home Sales
Fri - Sep 03 - 08:30 - Employment Report
Fri - Sep 03 - 10:00 - ISM Services
Charts of Interest: Tuesday and Thursday
This commentary and charts-of-interest are designed to stimulate thinking. This analysis is not a recommendation to buy, sell, hold or sell short any security (stock ETF or otherwise). We all need to think for ourselves when it comes to trading our own accounts. First, it is the only way to really learn. Second, we are the only ones responsible for our decisions. Think of these charts as food for further analysis. Before making a trade, it is important to have a plan. Plan the trade and trade the plan. Among other things, this includes setting a trigger level, a target area and a stop-loss level. It is also important to plan for three possible price movements: advance, decline or sideways. Have a plan for all three scenarios BEFORE making the trade. Consider possible holding times. And finally, look at overall market conditions and sector/industry performance.

About the author:
Arthur Hill, CMT, is the Chief Technical Strategist at TrendInvestorPro.com. Focusing predominantly on US equities and ETFs, his systematic approach of identifying trend, finding signals within the trend, and setting key price levels has made him an esteemed market technician. Arthur has written articles for numerous financial publications including Barrons and Stocks & Commodities Magazine. In addition to his Chartered Market Technician (CMT) designation, he holds an MBA from the Cass Business School at City University in London.
Learn More