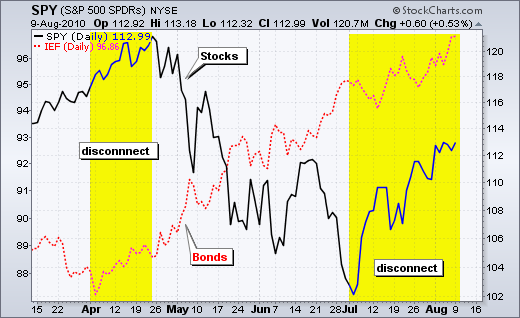
Don't fight the Fed. This Wall Street motto is as old as the Fed. Even if you doubt the Fed's ability to influence the long-term outcome, the Fed can still affect the short-term expectations. Quantitative easing (QE) is back on the table and this may keep a bid in stocks. Whether or not it will work is a moot point for traders. The Fed's affect on the market is what counts here. Frankly, QE is good news and bad news, perhaps more bad than good. Sure, easy money is good for banks and stocks. However, one has to wonder why the Fed is considering more QE. The Fed acts when the economy is not in good shape, which means the double dippers have an argument. The surge in bond prices and fall in bond yields suggests a double dip, but strength in stocks suggests otherwise. There is a big disconnect here and something has to give. The chart below shows a three week disconnect in April and a 5-6 week disconnect now.


There is no change on the daily chart. The medium-term trend remains up as SPY challenges resistance in the 112-114 area. SPY broke above the wedge trendline with a surge in mid July and this breakout is holding. In addition, the stock gapped up last Monday and this gap held all week. RSI moved above 60 in late July to turn momentum bullish. Despite this uptrend, there is a pretty stiff resistance zone in the 112-114 area. Resistance in this area stems from the mid June high, the late July high and the 50-62% retracement zone. Admittedly, this is an ideal spot for a bearish reversal and continuation of the April-July decline. However, we have yet to see a failure or reversal at this resistance. I am going to raise key support to 109. A close below this level would signal a failure at resistance and warrant a re-evaluation of the current uptrend.

No change. On the 60-minute chart, SPY is currently advancing with a rising wedge. While the rising wedge can be considered a bearish pattern, keep in mind that the trend is clearly up as long as the wedge rises. SPY broke consolidation support with a sharp move lower early Friday, but found support near the July trendline and bounced back above 112 by the close. This show of resilience should give the bears second thoughts. With this bounce, I will raise short-term support to 111. A close below this level would call for a re-evaluation of the short-term uptrend. RSI broke below 40 for the second time in three weeks, but quickly moved back above 50. I use a combination of RSI levels and price chart levels to confirm a trend reversal. A price break below support and a RSI break below 40 are both needed to confirm a short-term trend reversal.

It is a big week on the economic calendar and we could see some defining price movements from Wednesday to Friday. The Fed meets on Tuesday with a policy statement expected at 2:15PM ET. There is usually a lot of volatility (noise) just before and after the announcement. Price action from 1PM to 3PM is suspect. A sustainable move sometimes materializes after 3PM or the next morning. These are the two timeframes to watch closely. Friday is also a heavy day with CPI and Retail Sales before the open. Michigan Sentiment and Business Inventories are just after the open.
Key Economic Reports:
Tue - Aug 10 - 10:00 - Wholesale Inventories
Tue - Aug 10 - 14:15 - FOMC Rate Decision
Wed - Aug 11 - 10:30 - Crude Inventories
Thu - Aug 12 - 08:30 - Initial Claims
Fri - Aug 13 - 08:30 - CPI
Fri - Aug 13 - 08:30 - Retail Sales
Fri - Aug 13 - 09:55 - Michigan Sentiment
Fri - Aug 13 - 10:00 - Business Inventories
Charts of Interest: ALTR, AAPL, DELL, INTC, NKE, NXY, WAG


This commentary and charts-of-interest are designed to stimulate thinking. This analysis is not a recommendation to buy, sell, hold or sell short any security (stock ETF or otherwise). We all need to think for ourselves when it comes to trading our own accounts. First, it is the only way to really learn. Second, we are the only ones responsible for our decisions. Think of these charts as food for further analysis. Before making a trade, it is important to have a plan. Plan the trade and trade the plan. Among other things, this includes setting a trigger level, a target area and a stop-loss level. It is also important to plan for three possible price movements: advance, decline or sideways. Have a plan for all three scenarios BEFORE making the trade. Consider possible holding times. And finally, look at overall market conditions and sector/industry performance.

About the author:
Arthur Hill, CMT, is the Chief Technical Strategist at TrendInvestorPro.com. Focusing predominantly on US equities and ETFs, his systematic approach of identifying trend, finding signals within the trend, and setting key price levels has made him an esteemed market technician. Arthur has written articles for numerous financial publications including Barrons and Stocks & Commodities Magazine. In addition to his Chartered Market Technician (CMT) designation, he holds an MBA from the Cass Business School at City University in London.
Learn More