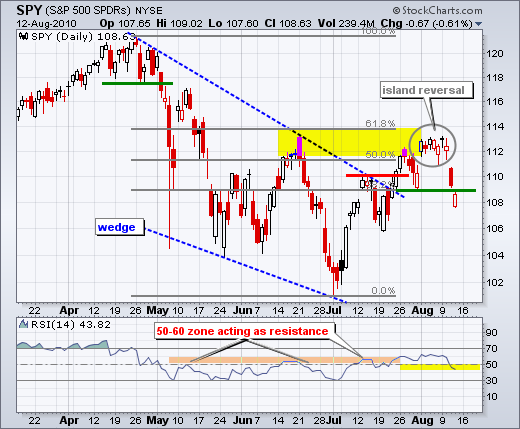
The S&P 500 ETF (SPY) gapped down again on the open, but managed to bounce and close well above its open to form a hollow candlestick. Even so, the ETF closed below its prior close to color the candlestick red. Nevertheless, SPY remains below its support break at 1088. I view the gap down and break below 1088 as a bearish development as we head into September-October. However, notice that RSI is in the 40-50 zone and this zone marks support in an uptrend. But did RSI really breakout? The indicator did edge above 60, but momentum was never strong enough to produce an overbought reading above 70. Not even close. According to RSI, the July rally was not that strong. At this point, I will be watching Wednesday's gap. The decision to be bearish is easy as long as this gap holds. A close above 112 would warrant a re-evaluation.


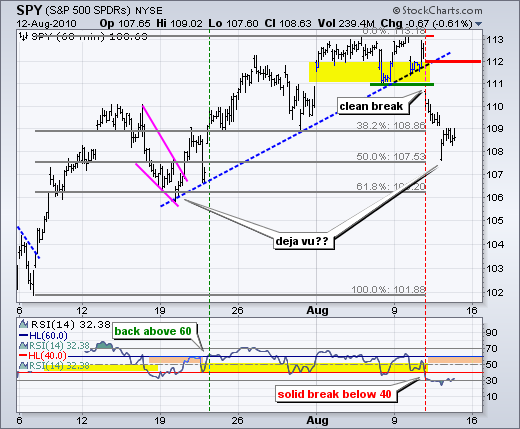
On the 60-minute chart, SPY broke support and retraced 50% of the July-August advance with a decline to 107.5 (yesterday's open). SPY also managed to bounce and firm after yesterday's gap. SPY was short-term oversold at 107.5 and an oversold bounce or consolidation is pretty normal at this stage. Broken support turns into the first resistance area around 111. RSI plunged below 30 on Wednesday and this oversold reading is a sign of weakness. It takes strong selling pressure to push this momentum oscillator below 30. The 50-60 zone becomes resistance and I will wait for a break back above 60 before considering momentum bullish again.

Key Economic Reports:
Fri - Aug 13 - 08:30 - CPI
Fri - Aug 13 - 08:30 - Retail Sales
Fri - Aug 13 - 09:55 - Michigan Sentiment
Fri - Aug 13 - 10:00 - Business Inventories
Charts of Interest: None today.
This commentary and charts-of-interest are designed to stimulate thinking. This analysis is not a recommendation to buy, sell, hold or sell short any security (stock ETF or otherwise). We all need to think for ourselves when it comes to trading our own accounts. First, it is the only way to really learn. Second, we are the only ones responsible for our decisions. Think of these charts as food for further analysis. Before making a trade, it is important to have a plan. Plan the trade and trade the plan. Among other things, this includes setting a trigger level, a target area and a stop-loss level. It is also important to plan for three possible price movements: advance, decline or sideways. Have a plan for all three scenarios BEFORE making the trade. Consider possible holding times. And finally, look at overall market conditions and sector/industry performance.

About the author:
Arthur Hill, CMT, is the Chief Technical Strategist at TrendInvestorPro.com. Focusing predominantly on US equities and ETFs, his systematic approach of identifying trend, finding signals within the trend, and setting key price levels has made him an esteemed market technician. Arthur has written articles for numerous financial publications including Barrons and Stocks & Commodities Magazine. In addition to his Chartered Market Technician (CMT) designation, he holds an MBA from the Cass Business School at City University in London.
Learn More