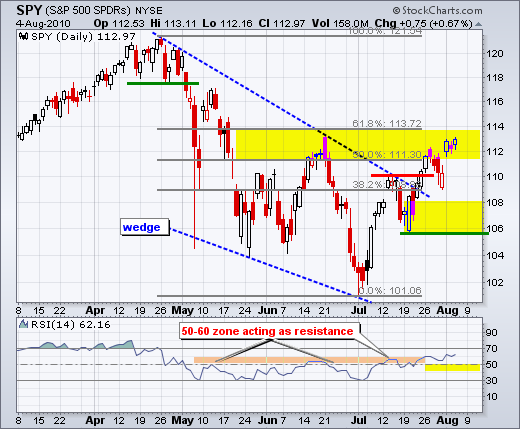
There is no change in the medium-term or short-term trends, which are both up. Even though SPY is trading in a resistance zone marked by the June high and 50-62% retracement zone, the trend is up and we have yet to see a failure or reversal at resistance. The break above the wedge trendline is holding. Monday's gap and surge above 112 are holding too. A move below 110 would fill the gap and a break below last week's low would provide the first significant sign of weakness. Keep in mind that a medium-term trend reversal begins with a short-term trend reversal. A move below 109 reverses the short-term uptrend, but I will keep medium-term support at 106-108 for now.

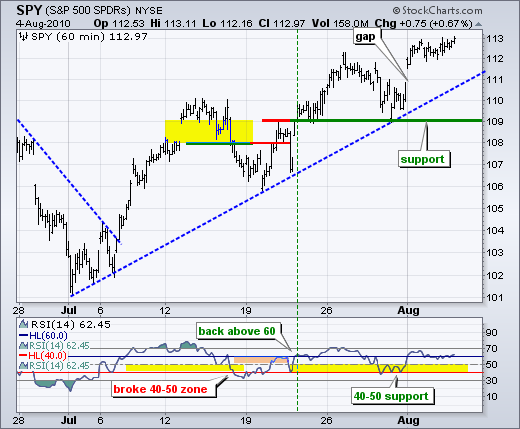
The 60-minute chart simply affirms the significance of support at 109. At this point, traders are held hostage to the market's reaction to jobless claims, which will be reported before the open. A positive surprise could give way to further gains. A negative surprise could knock stocks back rather hard. With SPY trading near 113 and short-term support at 109, there is plenty of room for the short-term uptrend to absorb a negative surprise. Also keep in mind that the employment picture may not be all that important to corporate prospects. Even most technicians admit that earnings are an important driver for stock prices. The stock market may be impressed if companies can increase profits with fewer employees (productivity). Not to belittle employees, but they are an expense on the P&L statement.
Key Economic Reports:
Thu - Aug 05 - 08:30 - Jobless Claims
Fri - Aug 06 - 08:30 - Employment Report
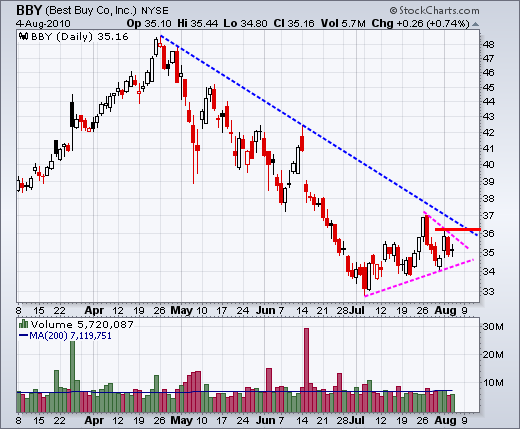
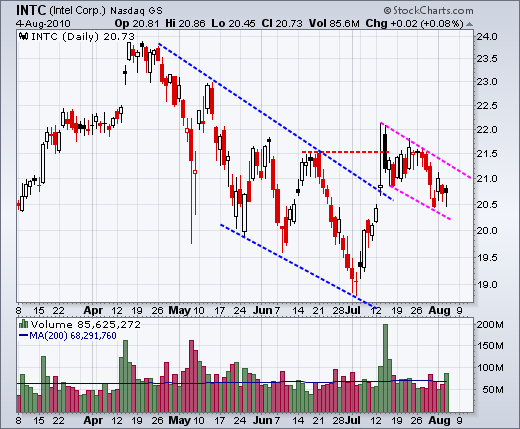
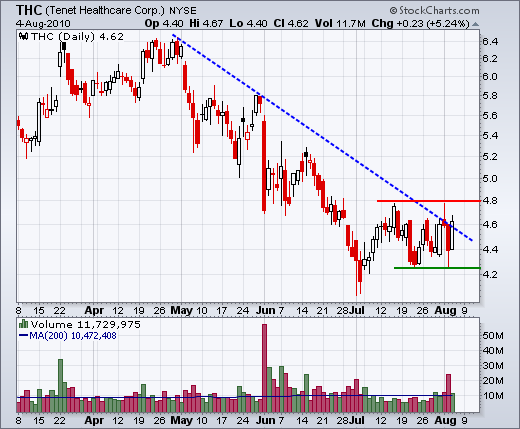
Charts of Interest: BBY, INTC, MDT, MRK, PMCS, SCHW, THC
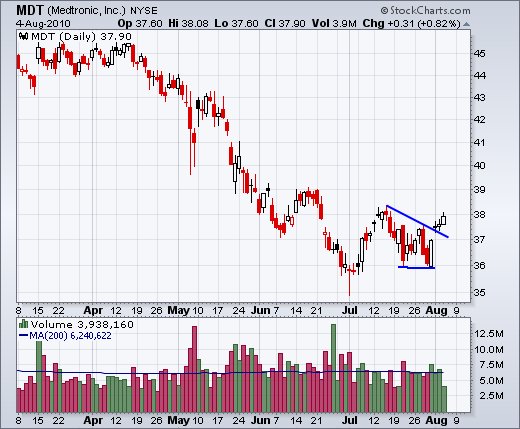
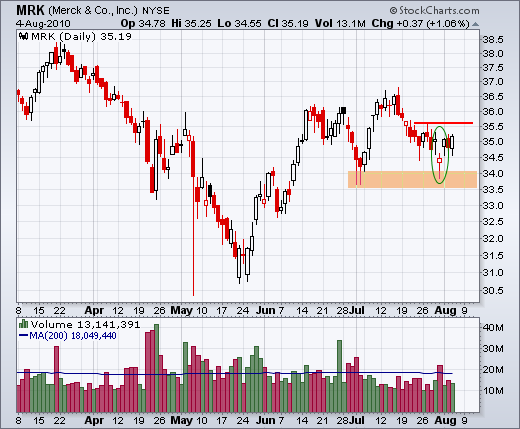
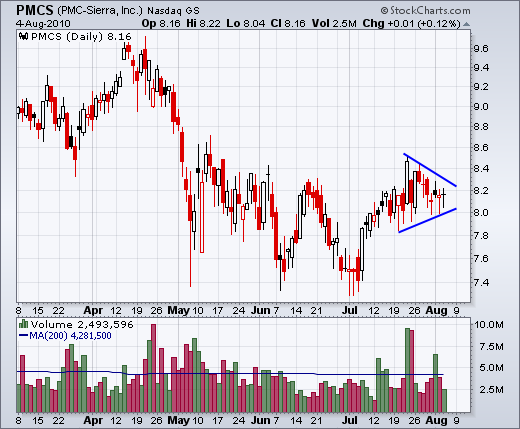
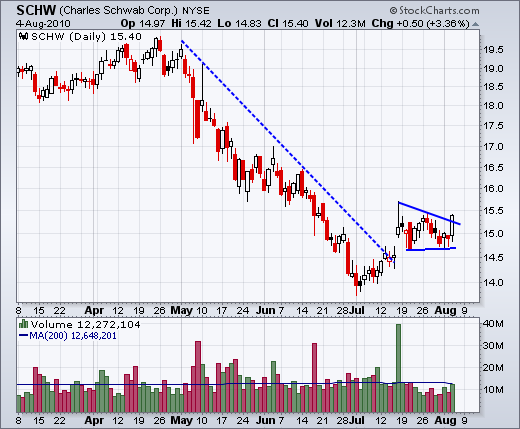
This commentary and charts-of-interest are designed to stimulate thinking. This analysis is not a recommendation to buy, sell, hold or sell short any security (stock ETF or otherwise). We all need to think for ourselves when it comes to trading our own accounts. First, it is the only way to really learn. Second, we are the only ones responsible for our decisions. Think of these charts as food for further analysis. Before making a trade, it is important to have a plan. Plan the trade and trade the plan. Among other things, this includes setting a trigger level, a target area and a stop-loss level. It is also important to plan for three possible price movements: advance, decline or sideways. Have a plan for all three scenarios BEFORE making the trade. Consider possible holding times. And finally, look at overall market conditions and sector/industry performance.

About the author:
Arthur Hill, CMT, is the Chief Technical Strategist at TrendInvestorPro.com. Focusing predominantly on US equities and ETFs, his systematic approach of identifying trend, finding signals within the trend, and setting key price levels has made him an esteemed market technician. Arthur has written articles for numerous financial publications including Barrons and Stocks & Commodities Magazine. In addition to his Chartered Market Technician (CMT) designation, he holds an MBA from the Cass Business School at City University in London.
Learn More