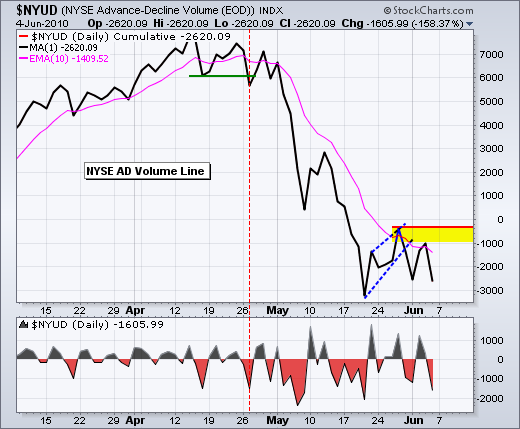
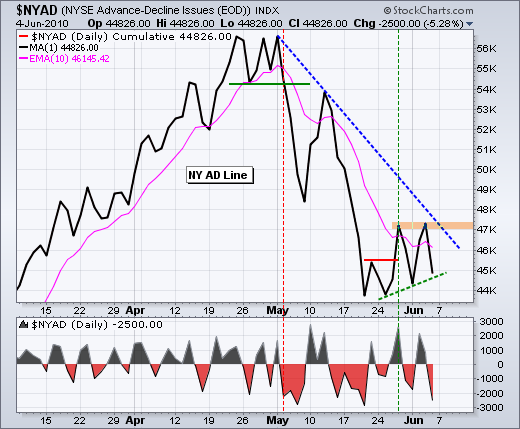
With another big decline last week, many breadth indicators established important resistance levels to watch. The chart below shows the NYSE AD Volume Line with resistance from the late May reaction high and early June reaction high. Even though the indicator remains above its May low, the overall trend is down and a break above this resistance zone is needed for reversal. The second chart shows the NYSE AD Line with a similar resistance zone. The Nasdaq AD Line and NYSE AD Volume Line show similar patterns.
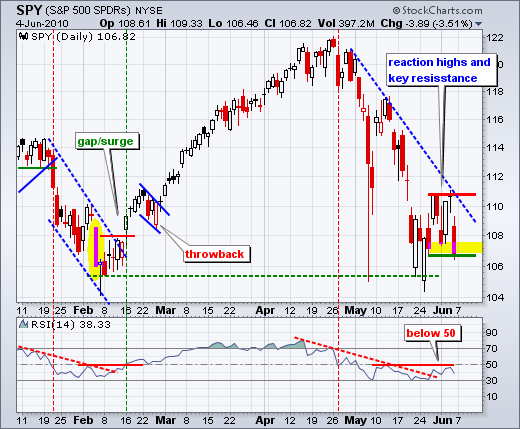
SPY remains in a downtrend on the daily chart. With Friday's sharp decline, the ETF affirmed resistance just below 111. SPY closed at 110.76 on May 27th and 110.71 on June 3rd. Even though the ETF remains above its February and May lows, a strong close above 111 is needed to fully reverse this downtrend. RSI confirms this downtrend as it remains below 50. A break above 50 is needed to turn momentum bullish.
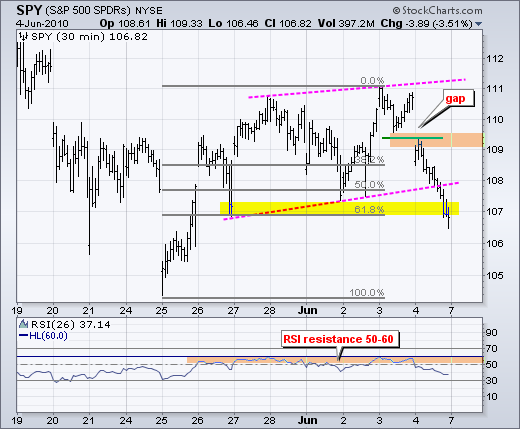
On the 30-minute chart, SPY failed to hold above 110 in late May and early June. The latest failure occurred with a gap down and support break at 109.40 on Friday. This breakdown is short-term bearish, but the ETF is already near a potential support zone around 107. First, there are the late May and early June lows around 106.85-107.37 (yellow area). Second, a 62% retracement of the prior advance marks potential support around 107. "Potential" is the key word here. We have yet to see any signs of firmness. 26-period RSI hit resistance in the 50-60 zone last week and declined below 40 on Friday. I adjusted the timeframe because there are 26 thirty minute periods in two days of trading. This look-back period also affirms resistance at 60 better. Look for RSI to break above 60 to show any material improvement in momentum.
Key Economic Reports:
Wed - Jun 09 - 10:30 - Crude Inventories
Wed - Jun 09 - 14:00 - Fed's Beige Book
Thu - Jun 10 - 08:30 - Initial Claims
Fri - Jun 11 - 08:30 - Retail Sales
Fri - Jun 11 - 09:55 - Mich Sentiment
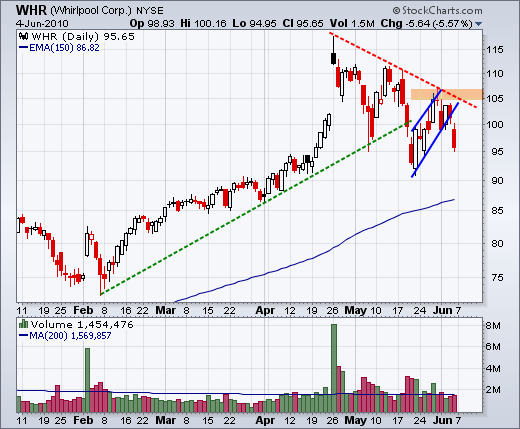
Charts of Interest: ABX, DRI, UPS, WHR
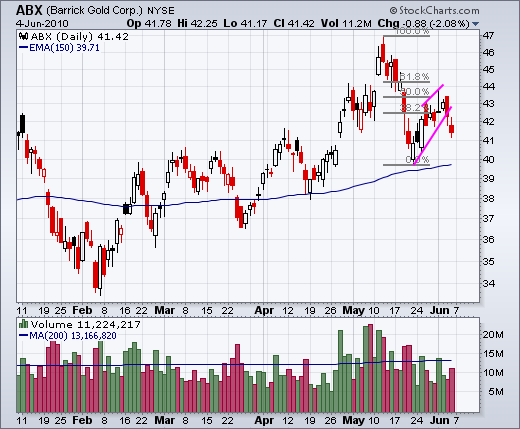
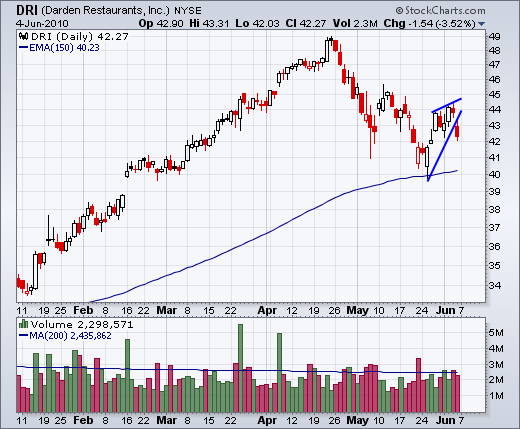
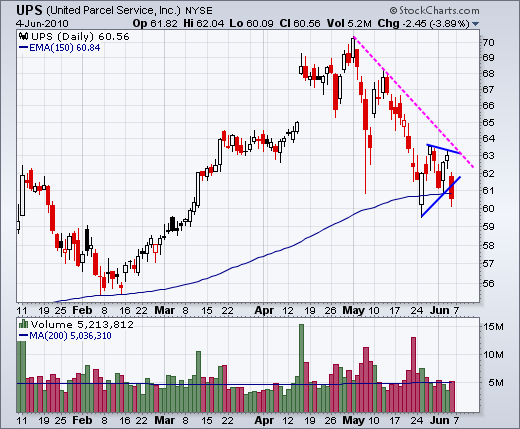
This commentary and charts-of-interest are designed to stimulate thinking. This analysis is not a recommendation to buy, sell, hold or sell short any security (stock ETF or otherwise). We all need to think for ourselves when it comes to trading our own accounts. First, it is the only way to really learn. Second, we are the only ones responsible for our decisions. Think of these charts as food for further analysis. Before making a trade, it is important to have a plan. Plan the trade and trade the plan. Among other things, this includes setting a trigger level, a target area and a stop-loss level. It is also important to plan for three possible price movements: advance, decline or sideways. Have a plan for all three scenarios BEFORE making the trade. Consider possible holding times. And finally, look at overall market conditions and sector/industry performance.

