The decline over the last four weeks was severe, but still within the realm of a bigger uptrend. The weekly chart still sports a series of higher highs and higher lows. A break below the February low is needed to end this series and call for the end of the major uptrend. This is important. Even though the decline was sharp, it is still considered a correction within a bigger uptrend.
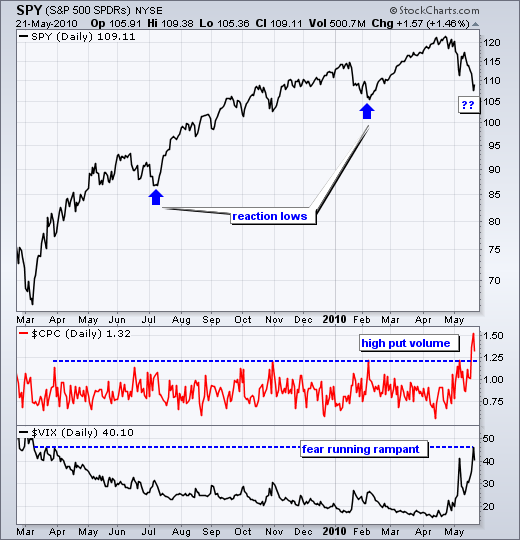

Also of note, the S&P 500 Volatility Index ($VIX) surged to its highest level since March 2009 and this shows excessive fear. The CBOE Put/Call Ratio ($CPC) surged to its highest level since November 2008 and this shows excessive put buying (bearishness). Sentiment-wise, the stage is set for a low in the coming days or weeks. It depends on how much healing (basing) is required to shake off the losses of the last four weeks. This basing process could involve choppy trading as the bulls and bears slug it out for supremacy.
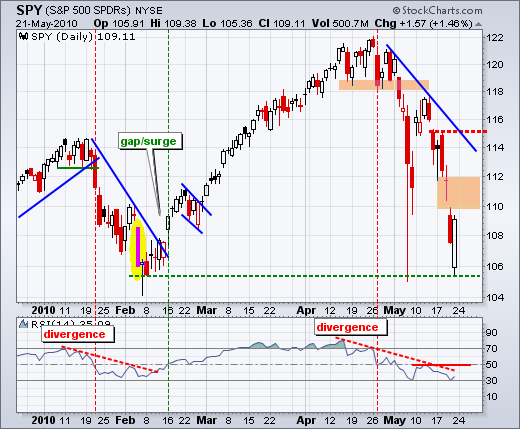
On the daily chart, SPY opened just below 106 and closed just above 109. The swing from low to high was around 3%. A piercing pattern formed and the long white candlestick provides the first evidence of support within this downtrend. While support in the 106 area is clear, picking a resistance level is more problematic. The 110-112 gap zone marks one possible resistance zone. The trendline extending down from the early May high marks resistance around 115. Momentum resistance, on the other hand, is pretty clear. As with the January-February decline, RSI has resistance around 50. A break above this level is needed to turn momentum bullish again. With the correction still underway, this stage of the game is for bottom pickers.
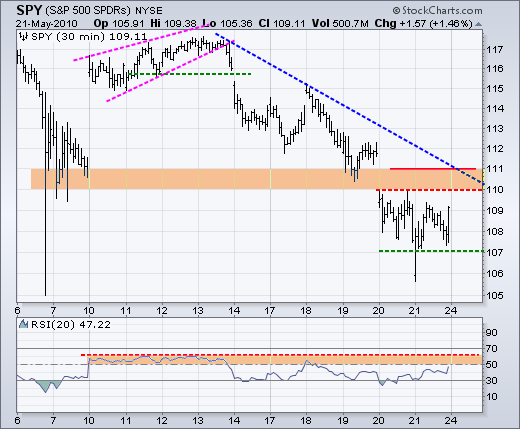
On the 30-minute chart, SPY opened weak with a gap below 106, but immediately rebounded and firmed around 107-109. Without the opening gap and recovery, SPY has been trading between 107 and 110 the last two days. All of the losses over the last two days occurred with the Thursday morning gap below 110. The top of the consolidation marks resistance. Technically, a break above 110 would be positive, but there is another resistance zone at 110-111. The trendline extending down from last week's high and broken support mark resistance in this area. Trading could be tricky in the coming days. RSI remains with resistance in the 50-60 zone. Look for a break above this level to turn short-term momentum bullish.
Key Economic Reports:
Mon - May 24 - 10:00 - Existing Home Sales
Tue - May 25 - 09:00 - Case-Shiller Index
Tue - May 25 - 10:00 - Consumer Confidence
Wed - May 26 - 08:30 - Durable Orders
Wed - May 26 - 10:00 - New Home Sales
Wed - May 26 - 10:30 - Crude Inventories
Thu - May 27 - 08:30 - GDP Estimate
Thu - May 27 - 08:30 - Initial Claims
Fri - May 28 - 09:45 - Personal Income and Spending
Fri - May 28 - 09:45 - Chicago PMI
Fri - May 28 - 09:55 - U. Michigan Consumer Sentiment
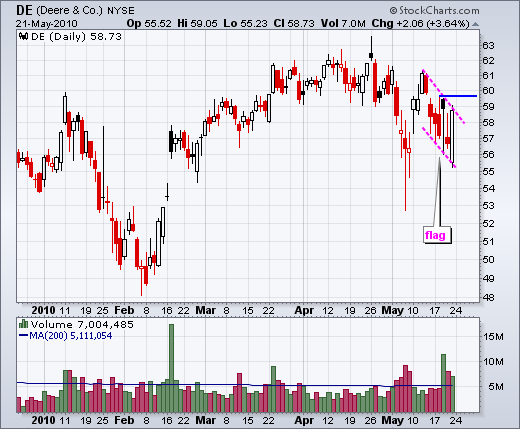
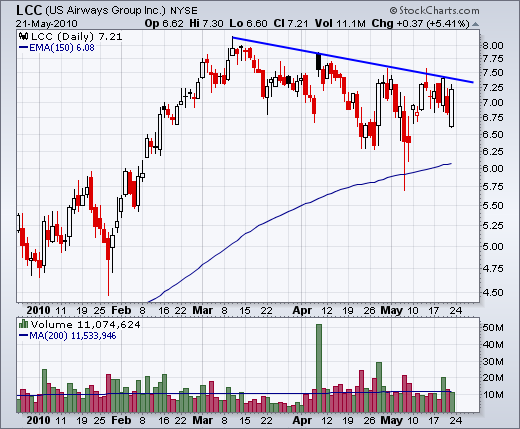
Charts of Interest: DE, LCC
This commentary and charts-of-interest are designed to stimulate thinking. This analysis is not a recommendation to buy, sell, hold or sell short any security (stock ETF or otherwise). We all need to think for ourselves when it comes to trading our own accounts. First, it is the only way to really learn. Second, we are the only ones responsible for our decisions. Think of these charts as food for further analysis. Before making a trade, it is important to have a plan. Plan the trade and trade the plan. Among other things, this includes setting a trigger level, a target area and a stop-loss level. It is also important to plan for three possible price movements: advance, decline or sideways. Have a plan for all three scenarios BEFORE making the trade. Consider possible holding times. And finally, look at overall market conditions and sector/industry performance.
On the daily chart, SPY opened just below 106 and closed just above 109. The swing from low to high was around 3%. A piercing pattern formed and the long white candlestick provides the first evidence of support within this downtrend. While support in the 106 area is clear, picking a resistance level is more problematic. The 110-112 gap zone marks one possible resistance zone. The trendline extending down from the early May high marks resistance around 115. Momentum resistance, on the other hand, is pretty clear. As with the January-February decline, RSI has resistance around 50. A break above this level is needed to turn momentum bullish again. With the correction still underway, this stage of the game is for bottom pickers.

On the 30-minute chart, SPY opened weak with a gap below 106, but immediately rebounded and firmed around 107-109. Without the opening gap and recovery, SPY has been trading between 107 and 110 the last two days. All of the losses over the last two days occurred with the Thursday morning gap below 110. The top of the consolidation marks resistance. Technically, a break above 110 would be positive, but there is another resistance zone at 110-111. The trendline extending down from last week's high and broken support mark resistance in this area. Trading could be tricky in the coming days. RSI remains with resistance in the 50-60 zone. Look for a break above this level to turn short-term momentum bullish.

Key Economic Reports:
Mon - May 24 - 10:00 - Existing Home Sales
Tue - May 25 - 09:00 - Case-Shiller Index
Tue - May 25 - 10:00 - Consumer Confidence
Wed - May 26 - 08:30 - Durable Orders
Wed - May 26 - 10:00 - New Home Sales
Wed - May 26 - 10:30 - Crude Inventories
Thu - May 27 - 08:30 - GDP Estimate
Thu - May 27 - 08:30 - Initial Claims
Fri - May 28 - 09:45 - Personal Income and Spending
Fri - May 28 - 09:45 - Chicago PMI
Fri - May 28 - 09:55 - U. Michigan Consumer Sentiment
Charts of Interest: DE, LCC


This commentary and charts-of-interest are designed to stimulate thinking. This analysis is not a recommendation to buy, sell, hold or sell short any security (stock ETF or otherwise). We all need to think for ourselves when it comes to trading our own accounts. First, it is the only way to really learn. Second, we are the only ones responsible for our decisions. Think of these charts as food for further analysis. Before making a trade, it is important to have a plan. Plan the trade and trade the plan. Among other things, this includes setting a trigger level, a target area and a stop-loss level. It is also important to plan for three possible price movements: advance, decline or sideways. Have a plan for all three scenarios BEFORE making the trade. Consider possible holding times. And finally, look at overall market conditions and sector/industry performance.

About the author:
Arthur Hill, CMT, is the Chief Technical Strategist at TrendInvestorPro.com. Focusing predominantly on US equities and ETFs, his systematic approach of identifying trend, finding signals within the trend, and setting key price levels has made him an esteemed market technician. Arthur has written articles for numerous financial publications including Barrons and Stocks & Commodities Magazine. In addition to his Chartered Market Technician (CMT) designation, he holds an MBA from the Cass Business School at City University in London.
Learn More