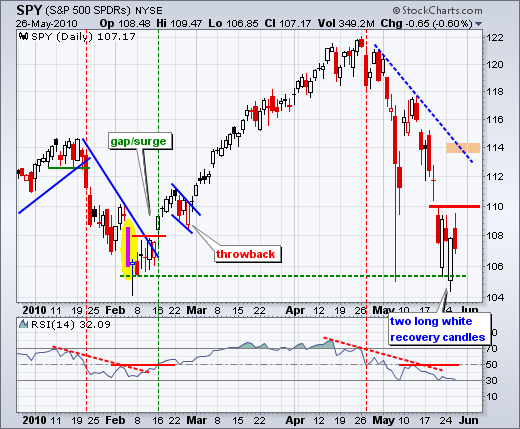
SPY followed through on Tuesday's reversal day with a surge above 109 in early trading, but failed to hold early gains and closed in negative territory for the day. It looks like a redux of Friday-Monday. While the inability to follow through is not positive, the two long white intraday recovery candlesticks remain in place. These confirm support in the 106 area. A solid follow through surge above resistance at 110 is needed to reverse the short-term downtrend. Strength requires good volume and breadth. RSI is flattening out near oversold levels. A break above 50 is needed to turn RSI bullish again.

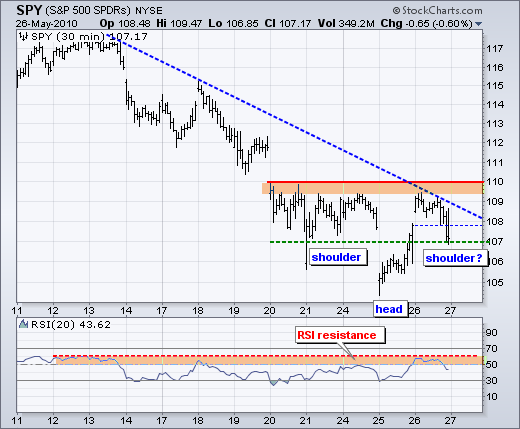
The 30-minute chart sports a potential inverse head-and-shoulders pattern over the last few days. The left shoulder formed 20-24 May, the head formed with Tuesday's gap down and the right shoulder is under construction. If we take out the 21-May gap down and 25-May gap down, SPY has basically been consolidating between 107 and 110 the last five days. A daily close only chart reflects five days of flat trading. Neckline resistance is also set at 110 and a break above this level would confirm the pattern. Also look for RSI to break 60. This is still bottom-pickers territory, but risk is better defined with a possible reaction low at 106.85 yesterday. The futures are pointing to a strong open. Failure to hold early gains and a break below 106.7 would be negative. With plenty of geopolitical events still in play, the other concern is a three day weekend.
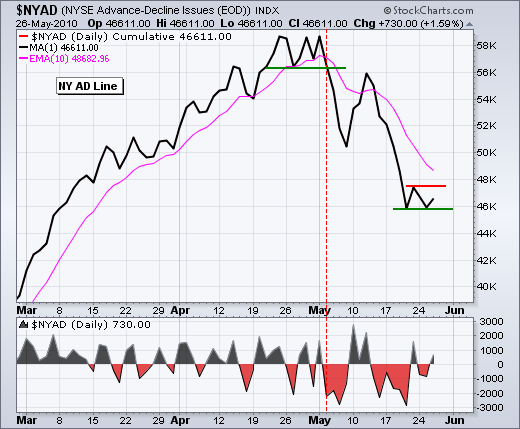
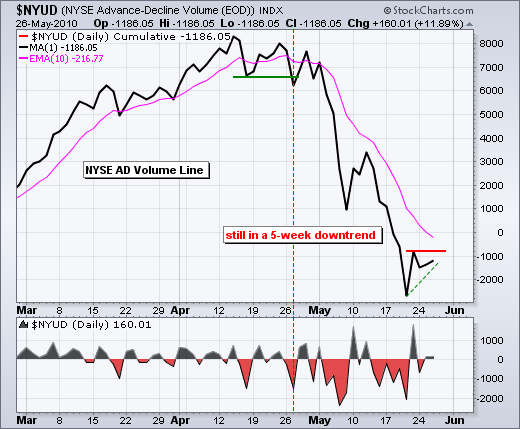
Despite the inability to follow through on these reversal days, there are some positives lurking out there. Last week we saw short-term sentiment reach extreme bearish levels, which is bullish for the market. This week we are seeing relative strength in small-caps. This makes sense because small-caps generally have less overseas exposure than large-caps. The consumer discretionary sector is also showing relative strength and this bodes well for the domestic economy (sans Europe). There are also signs of improving short-term breadth on the NYSE. The NYSE AD Line found support at last week's low and the NYSE AD Volume Line formed a higher low this week. Upside breakouts in both would be short-term bullish for the market.
Key Economic Reports:
Thu - May 27 - 08:30 - GDP Estimate
Thu - May 27 - 08:30 - Initial Claims
Fri - May 28 - 09:45 - Personal Income and Spending
Fri - May 28 - 09:45 - Chicago PMI
Fri - May 28 - 09:55 - U. Michigan Consumer Sentiment
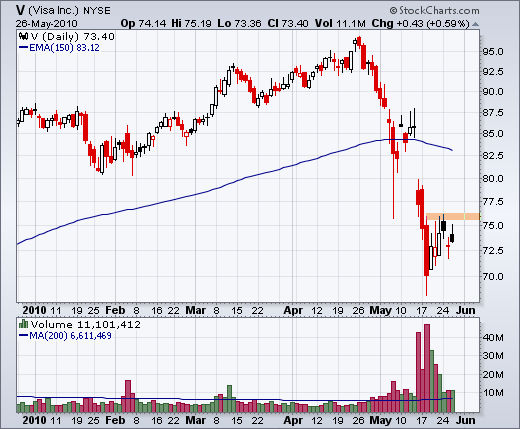
Charts of Interest: ADI, IMN, LRCX, MOT, V
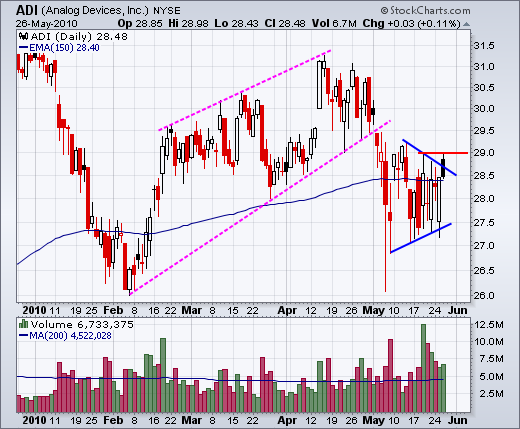
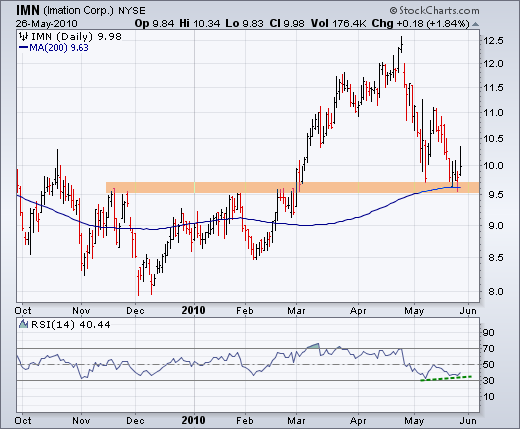
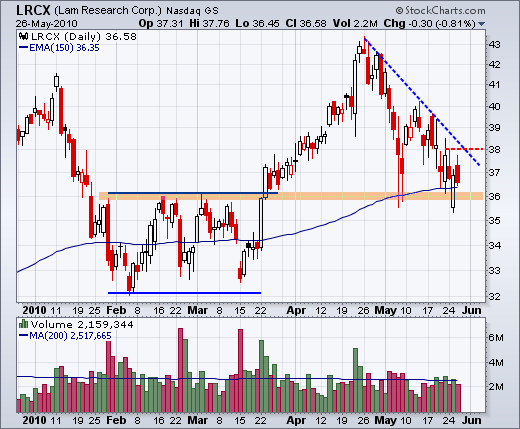
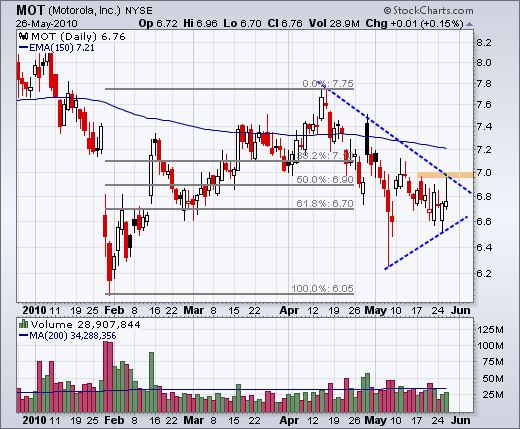
This commentary and charts-of-interest are designed to stimulate thinking. This analysis is not a recommendation to buy, sell, hold or sell short any security (stock ETF or otherwise). We all need to think for ourselves when it comes to trading our own accounts. First, it is the only way to really learn. Second, we are the only ones responsible for our decisions. Think of these charts as food for further analysis. Before making a trade, it is important to have a plan. Plan the trade and trade the plan. Among other things, this includes setting a trigger level, a target area and a stop-loss level. It is also important to plan for three possible price movements: advance, decline or sideways. Have a plan for all three scenarios BEFORE making the trade. Consider possible holding times. And finally, look at overall market conditions and sector/industry performance.

Despite the inability to follow through on these reversal days, there are some positives lurking out there. Last week we saw short-term sentiment reach extreme bearish levels, which is bullish for the market. This week we are seeing relative strength in small-caps. This makes sense because small-caps generally have less overseas exposure than large-caps. The consumer discretionary sector is also showing relative strength and this bodes well for the domestic economy (sans Europe). There are also signs of improving short-term breadth on the NYSE. The NYSE AD Line found support at last week's low and the NYSE AD Volume Line formed a higher low this week. Upside breakouts in both would be short-term bullish for the market.


Key Economic Reports:
Thu - May 27 - 08:30 - GDP Estimate
Thu - May 27 - 08:30 - Initial Claims
Fri - May 28 - 09:45 - Personal Income and Spending
Fri - May 28 - 09:45 - Chicago PMI
Fri - May 28 - 09:55 - U. Michigan Consumer Sentiment
Charts of Interest: ADI, IMN, LRCX, MOT, V


This commentary and charts-of-interest are designed to stimulate thinking. This analysis is not a recommendation to buy, sell, hold or sell short any security (stock ETF or otherwise). We all need to think for ourselves when it comes to trading our own accounts. First, it is the only way to really learn. Second, we are the only ones responsible for our decisions. Think of these charts as food for further analysis. Before making a trade, it is important to have a plan. Plan the trade and trade the plan. Among other things, this includes setting a trigger level, a target area and a stop-loss level. It is also important to plan for three possible price movements: advance, decline or sideways. Have a plan for all three scenarios BEFORE making the trade. Consider possible holding times. And finally, look at overall market conditions and sector/industry performance.

About the author:
Arthur Hill, CMT, is the Chief Technical Strategist at TrendInvestorPro.com. Focusing predominantly on US equities and ETFs, his systematic approach of identifying trend, finding signals within the trend, and setting key price levels has made him an esteemed market technician. Arthur has written articles for numerous financial publications including Barrons and Stocks & Commodities Magazine. In addition to his Chartered Market Technician (CMT) designation, he holds an MBA from the Cass Business School at City University in London.
Learn More