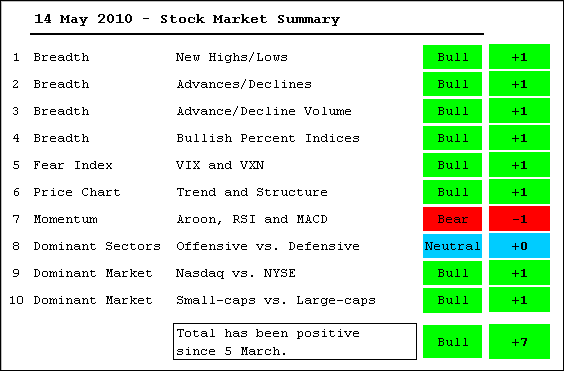
After a drubbing over the prior two weeks, stocks rebounded with a sharp rally this week. For now, the drubbing was stronger than the rebound. However, the rebound established reaction lows in the AD Lines and the major index ETFs that should be watched for a possible trend reversal. A downtrend requires a lower low, pure and simple. The AD Lines, AD Volume Lines, major index ETFs and key sector SPDRs all recorded new 52-week highs in late April. Moreover, stocks were way overbought after the February-April run. A correction or pullback is entirely normal. At some point, a correction or pullback will overstay its welcome and produce a bigger trend reversal. In my opinion, we have yet to reach that point and the bulk of the evidence suggest that the uptrend remains in place.
- AD Lines: Bullish. The Nasdaq and NYSE AD Lines recorded new 52-week highs in April and the overall trend remains up. Reaction lows formed with this week's bounce. A break below these lows would warrant a reassessment.
- AD Volume Lines: Bullish. The Nasdaq and NYSE AD Volume Lines also recorded new 52-week highs in April. I am, however, concerned with these two indicators. The NYSE AD Volume Line was decimated in May, while the Nasdaq AD Volume Line barely bounced over the last four days.
- Net New Highs: Bullish. The 10-day SMA for Net New Highs remains barely positive in both the Nasdaq and NYSE. It is the moment-of-truth for this indicator. Another sharp decline in the stock market could push this indicator into the red.
- Bullish Percent Indices: Bullish. The Bullish Percent Indices are clearly below their highs, but remain above the 50% threshold (except for energy at 39.34%). The bulls have the edge as long as the majority of stocks remain on Point & Figure buy signals.
- Sentiment: Bullish. I am going to combine a few sentiment indicators. Remember, excessive bearishness (fear) is bullish for stocks and excessive bullishness (complacency) is bearish. The S&P 500 Volatility Index ($VIX) and Nasdaq 100 Volatility Index ($VXN) broke above their January-February highs last week as fear reached extremes. These two have pulled back, but remain relatively high. The CBOE Put/Call Ratio ($CPC) still shows excessive bearishness.
- Trend Structure: Bullish. The major index ETFs all recorded new 52-week highs in April, retraced 50-62% of the February-April advance and forged higher lows with this week's bounce. We have yet to see a lower low or definitive trend change.
- SPY Momentum: Bearish. The Aroon Oscillator and MACD (5,35,5) remain in negative territory. RSI broke below 50.
- Offensive Sector Performance: Neutral. Technology, consumer discretionary, industrials and finance led the way lower during the decline, but also led the way higher on this week's bounce. XLY, XLK, XLI and XLF are now near resistance from broken support (April lows).
- Nasdaq Performance: Bullish. The Nasdaq continues to hold up better than the NY Composite.
- Small-caps Performance: Bullish. The Russell 2000 led the way higher over the last four days.
This table is designed to offer an objective look at current market conditions. It does not aim to pick tops or bottoms. Instead, it seeks to identify noticeable shifts in buying and selling pressure. With 10 indicator groups, the medium-term evidence is unlikely to change drastically overnight. The evidence was bullish from early September until late January. The Jan-Feb decline was enough to turn the evidence bearish on February 5th, but this decline turned out to be a correction and the evidence turned bullish again on March 5th. It is not immune to whipsaws.

About the author:
Arthur Hill, CMT, is the Chief Technical Strategist at TrendInvestorPro.com. Focusing predominantly on US equities and ETFs, his systematic approach of identifying trend, finding signals within the trend, and setting key price levels has made him an esteemed market technician. Arthur has written articles for numerous financial publications including Barrons and Stocks & Commodities Magazine. In addition to his Chartered Market Technician (CMT) designation, he holds an MBA from the Cass Business School at City University in London.
Learn More
