Stock futures are trading sharply higher on news of a comprehensive $962 billion EU bailout package. As of 5AM ET, the Dow is up some 350 points, the S&P 500 is up 47, oil is up $3, gold is down $21, US bonds are down sharply, EU bonds are up sharply and the Euro is up sharply. It is certainly not a dull market, that's for sure. Once again, the debt has been passed on to a higher level. As with the US, somebody will have to pay for this debt at some point.
On the daily chart, SPY is poised to open somewhere above 114. The decline over the last 10 days retraced just over 62% of the prior advance (on a closing basis). I am using closing prices because of Thursday's dip below 106. SPY also dipped below 110 on Friday, but closed well off its lows. A hammer did not form, but there was a fair amount of indecision in Fridays' trading. Volume on Thursday and Friday was extremely high, which smacks of capitulation. In addition, the VIX surged to show a sharp increase in fear, the CBOE Put/Call Ratio ($CPC) shows excessive bearishness and RSI became oversold (almost). While the EU action is the catalyst, the ingredients for a bounce were present in the technicals. Can all concerns be put to rest in one day? Probably not. We may see a bounce and then a retest of the lows around 111-112. Perhaps a pattern similar to August-October 1998 will evolve. This is when the markets went through the 1998 Russian financial crisis. Check Wikipedia for details.
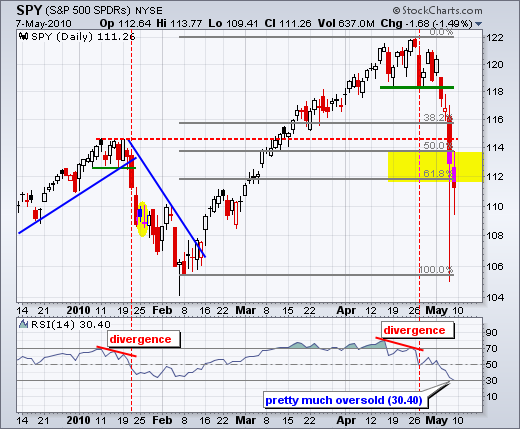
On the daily chart, SPY is poised to open somewhere above 114. The decline over the last 10 days retraced just over 62% of the prior advance (on a closing basis). I am using closing prices because of Thursday's dip below 106. SPY also dipped below 110 on Friday, but closed well off its lows. A hammer did not form, but there was a fair amount of indecision in Fridays' trading. Volume on Thursday and Friday was extremely high, which smacks of capitulation. In addition, the VIX surged to show a sharp increase in fear, the CBOE Put/Call Ratio ($CPC) shows excessive bearishness and RSI became oversold (almost). While the EU action is the catalyst, the ingredients for a bounce were present in the technicals. Can all concerns be put to rest in one day? Probably not. We may see a bounce and then a retest of the lows around 111-112. Perhaps a pattern similar to August-October 1998 will evolve. This is when the markets went through the 1998 Russian financial crisis. Check Wikipedia for details.

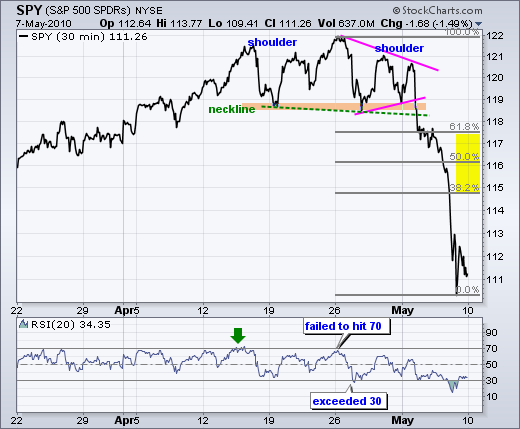
On the 30-minute chart, I overlaid the Fibonacci Retracements Tool to show resistance zone estimates for today's expected bounce. With an open expected above 115, SPY will be trading in this resistance zone right away.
Key Economic reports:
Wed - May 12 - 10:30AM - Crude Inventories
Thu - May 13 - 08:30AM - Initial Claims
Fri - May 14 - 08:30AM - Retail Sales
Fri - May 14 - 09:15AM - Industrial Production
Fri - May 14 - 09:55AM - Mich Sentiment
This commentary and charts-of-interest are designed to stimulate thinking. This analysis is not a recommendation to buy, sell, hold or sell short any security (stock ETF or otherwise). We all need to think for ourselves when it comes to trading our own accounts. First, it is the only way to really learn. Second, we are the only ones responsible for our decisions. Think of these charts as food for further analysis. Before making a trade, it is important to have a plan. Plan the trade and trade the plan. Among other things, this includes setting a trigger level, a target area and a stop-loss level. It is also important to plan for three possible price movements: advance, decline or sideways. Have a plan for all three scenarios BEFORE making the trade. Consider possible holding times. And finally, look at overall market conditions and sector/industry performance.

Key Economic reports:
Wed - May 12 - 10:30AM - Crude Inventories
Thu - May 13 - 08:30AM - Initial Claims
Fri - May 14 - 08:30AM - Retail Sales
Fri - May 14 - 09:15AM - Industrial Production
Fri - May 14 - 09:55AM - Mich Sentiment
Intermarket Charts have been updated (click here)
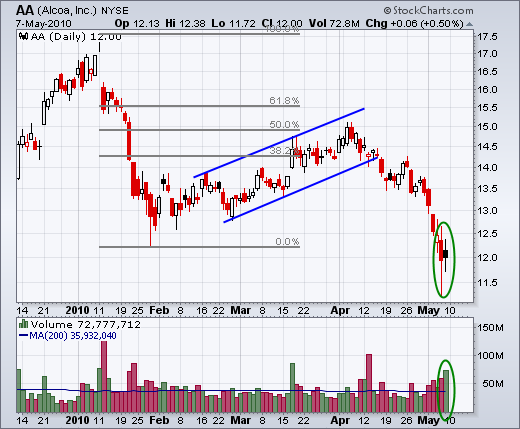
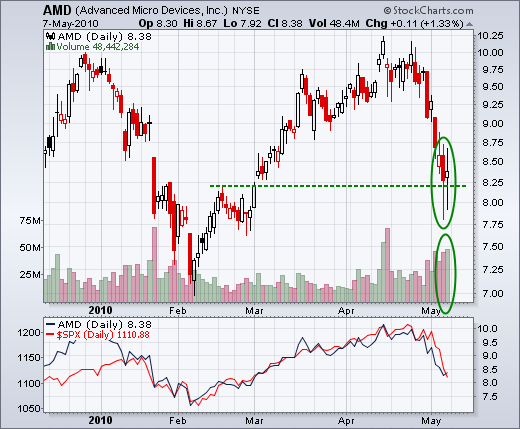
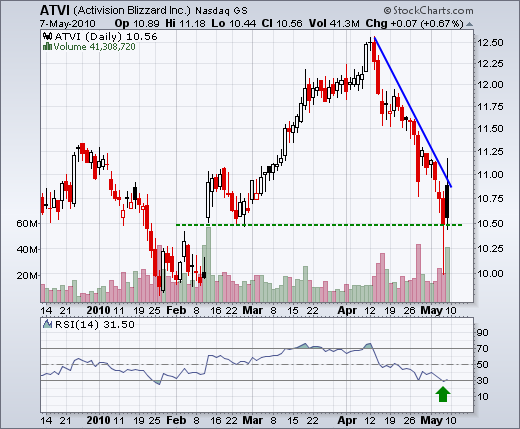
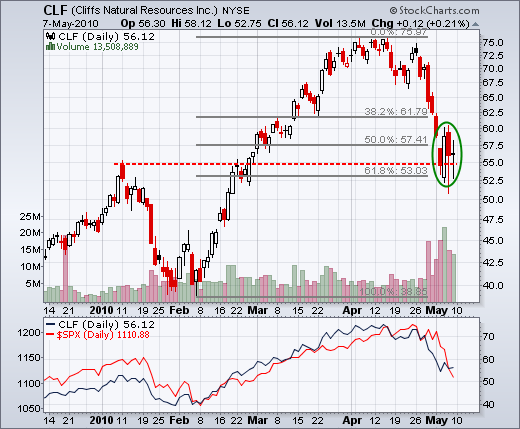
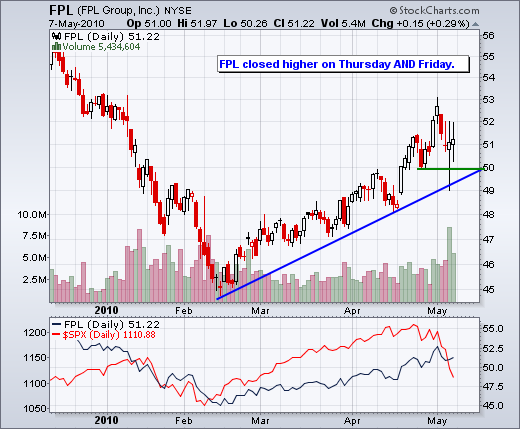
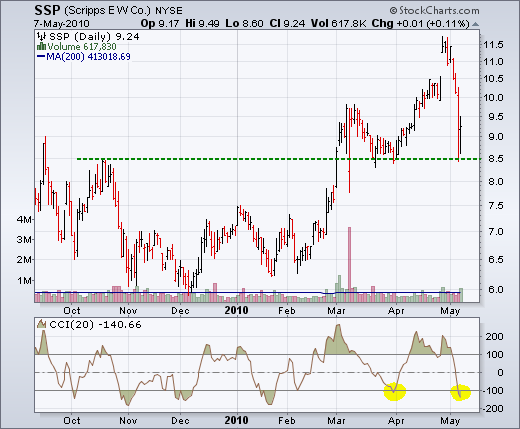
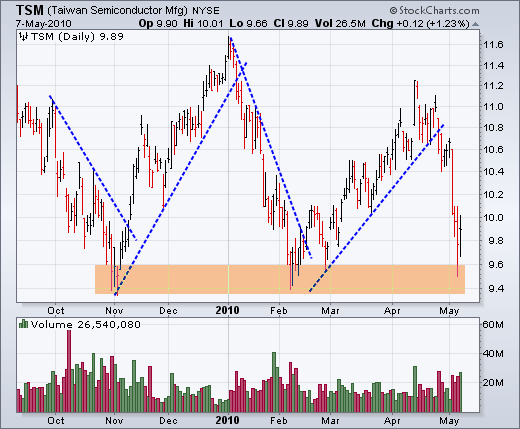
Charts of Interest: AA, AMD, ATVI, CLF, FPL, SSP, TSM.
The markets remain far from calm so be careful out there.


This commentary and charts-of-interest are designed to stimulate thinking. This analysis is not a recommendation to buy, sell, hold or sell short any security (stock ETF or otherwise). We all need to think for ourselves when it comes to trading our own accounts. First, it is the only way to really learn. Second, we are the only ones responsible for our decisions. Think of these charts as food for further analysis. Before making a trade, it is important to have a plan. Plan the trade and trade the plan. Among other things, this includes setting a trigger level, a target area and a stop-loss level. It is also important to plan for three possible price movements: advance, decline or sideways. Have a plan for all three scenarios BEFORE making the trade. Consider possible holding times. And finally, look at overall market conditions and sector/industry performance.

About the author:
Arthur Hill, CMT, is the Chief Technical Strategist at TrendInvestorPro.com. Focusing predominantly on US equities and ETFs, his systematic approach of identifying trend, finding signals within the trend, and setting key price levels has made him an esteemed market technician. Arthur has written articles for numerous financial publications including Barrons and Stocks & Commodities Magazine. In addition to his Chartered Market Technician (CMT) designation, he holds an MBA from the Cass Business School at City University in London.
Learn More