I am almost back in the saddle. Vacations are great, but it usually takes a day or two to get re-acclimated to the market environment. Stocks remained strong the last two weeks as the major index ETFs hit new highs for the move last week. The Dollar slipped as the Euro got an oversold bounce, but concerns over Greece could resurface at anytime. Weakness in the Dollar pushed gold higher the first part of the month, but the rally stalled last week and gold took a hard hit on Friday. Oil benefited from weakness in the Dollar and continued strength in the stock market. The long bond broke below its January low, but recovered with a rather sharp bounce the last eight days.
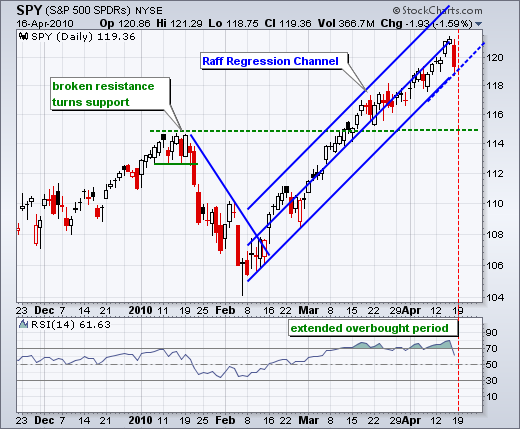
The first chart shows the S&P 500 ETF (SPY) within a Raff Regression Channel over the last 10 weeks. SPY was hit hard on Friday as the finance sector led the market lower. News that the SEC is investigating Goldman Sachs reverberated throughout the sector. Despite Friday's sharp decline, channel support has yet to be broken and the uptrend remains in place. Further weakness with a channel break would target a move towards broken resistance around 115.
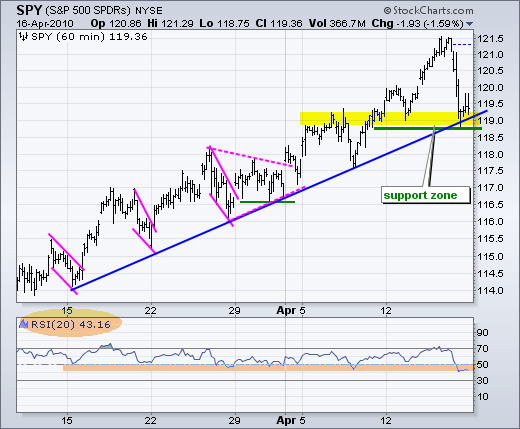
On the 30 minute chart, SPY declined to a support zone around 119. Support in this area stems from last week's reaction low and broken resistance from the early April highs. There is also support here from the mid March trendline. With the UK and Germany following the US lead on Goldman Sachs, we could see further pressure on the finance sector on Monday. This in turn could weigh on SPY and target a move towards the next support zone around 117-117.5. The indicator windows shows 20-period RSI, instead of 10-period. I lengthened the number of periods to make the indicator less sensitive and capture the current uptrend. RSI should remain in the 40-90 zone during an uptrend. 20-period RSI is currently near 40 and further weakness would be negative for short-term momentum.
Economic reports:
Mon - Apr 19 - 10:00AM - Leading Indicators
Wed - Apr 21 - 10:30AM - Crude Inventories
Thu - Apr 22 - 8:30AM - Initial Claims
Thu - Apr 22 - 8:30AM - Continuing Claims
Thu - Apr 22 - 08:30AM - PPI
Thu - Apr 22 - 10:00AM - Existing Home Sales
Fri - Apr 23 - 08:30AM - Durable Orders
Fri - Apr 23 - 10:00AM - New Home Sales
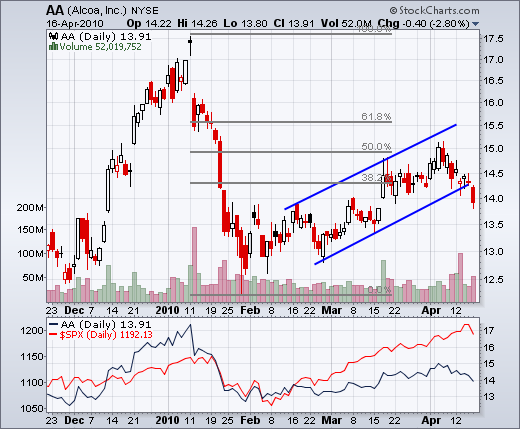
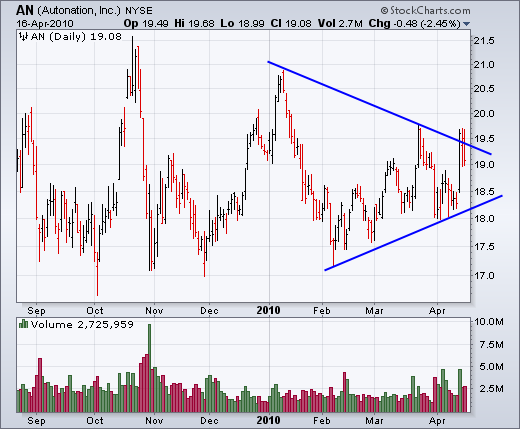
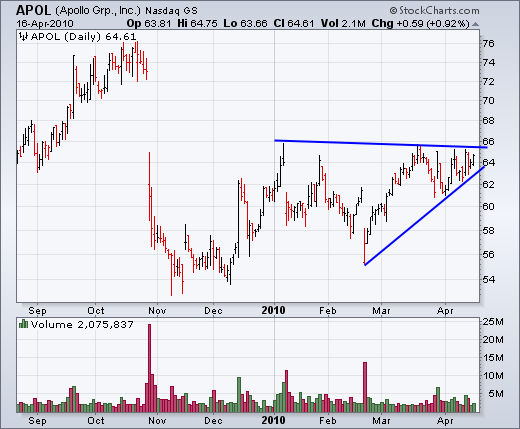
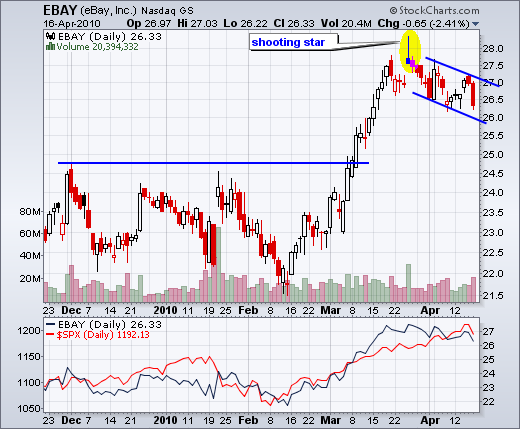
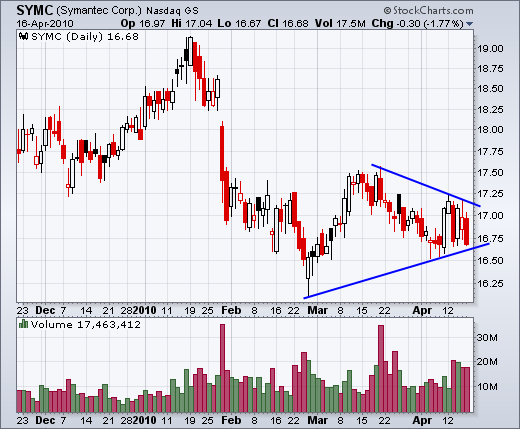
Charts of interest: AA, AN, APOL, EBAY, SYMC
This commentary and charts-of-interest are designed to stimulate thinking. This analysis is not a recommendation to buy, sell, hold or sell short any security (stock ETF or otherwise). We all need to think for ourselves when it comes to trading our own accounts. First, it is the only way to really learn. Second, we are the only ones responsible for our decisions. Think of these charts as food for further analysis. Before making a trade, it is important to have a plan. Plan the trade and trade the plan. Among other things, this includes setting a trigger level, a target area and a stop-loss level. It is also important to plan for three possible price movements: advance, decline or sideways. Have a plan for all three scenarios BEFORE making the trade. Consider possible holding times. And finally, look at overall market conditions and sector/industry performance.
The first chart shows the S&P 500 ETF (SPY) within a Raff Regression Channel over the last 10 weeks. SPY was hit hard on Friday as the finance sector led the market lower. News that the SEC is investigating Goldman Sachs reverberated throughout the sector. Despite Friday's sharp decline, channel support has yet to be broken and the uptrend remains in place. Further weakness with a channel break would target a move towards broken resistance around 115.

On the 30 minute chart, SPY declined to a support zone around 119. Support in this area stems from last week's reaction low and broken resistance from the early April highs. There is also support here from the mid March trendline. With the UK and Germany following the US lead on Goldman Sachs, we could see further pressure on the finance sector on Monday. This in turn could weigh on SPY and target a move towards the next support zone around 117-117.5. The indicator windows shows 20-period RSI, instead of 10-period. I lengthened the number of periods to make the indicator less sensitive and capture the current uptrend. RSI should remain in the 40-90 zone during an uptrend. 20-period RSI is currently near 40 and further weakness would be negative for short-term momentum.

Economic reports:
Mon - Apr 19 - 10:00AM - Leading Indicators
Wed - Apr 21 - 10:30AM - Crude Inventories
Thu - Apr 22 - 8:30AM - Initial Claims
Thu - Apr 22 - 8:30AM - Continuing Claims
Thu - Apr 22 - 08:30AM - PPI
Thu - Apr 22 - 10:00AM - Existing Home Sales
Fri - Apr 23 - 08:30AM - Durable Orders
Fri - Apr 23 - 10:00AM - New Home Sales
Charts of interest: AA, AN, APOL, EBAY, SYMC


This commentary and charts-of-interest are designed to stimulate thinking. This analysis is not a recommendation to buy, sell, hold or sell short any security (stock ETF or otherwise). We all need to think for ourselves when it comes to trading our own accounts. First, it is the only way to really learn. Second, we are the only ones responsible for our decisions. Think of these charts as food for further analysis. Before making a trade, it is important to have a plan. Plan the trade and trade the plan. Among other things, this includes setting a trigger level, a target area and a stop-loss level. It is also important to plan for three possible price movements: advance, decline or sideways. Have a plan for all three scenarios BEFORE making the trade. Consider possible holding times. And finally, look at overall market conditions and sector/industry performance.

About the author:
Arthur Hill, CMT, is the Chief Technical Strategist at TrendInvestorPro.com. Focusing predominantly on US equities and ETFs, his systematic approach of identifying trend, finding signals within the trend, and setting key price levels has made him an esteemed market technician. Arthur has written articles for numerous financial publications including Barrons and Stocks & Commodities Magazine. In addition to his Chartered Market Technician (CMT) designation, he holds an MBA from the Cass Business School at City University in London.
Learn More