Mark Hulbert of CBS MarketWatch reports the following: Ned Davis, of Ned Davis Research, reported on Wednesday of this week that his firm's so-called "Crowd Sentiment Poll," which is a composite of a number of separate sentiment indicators, had just risen into the "Extreme Optimism" zone. As recently as this past February, in contrast, Davis' "Crowd Sentiment Poll" had been in the "Extreme Pessimism" zone. So there's been a huge swing in sentiment in a very short period of time.
The Commitment of Traders (COT) reports for the e-mini shows Commercials turning net short and Small Specs net long. Commercials are viewed as the smart money, while small specs are viewed as dumb money. I don't, however, take it personally though. The net position of small specs is viewed as a contrarian indicator. It is bullish when small specs are net short and bearish when small specs are net long. It is also important to watch the Rate-of-Change for these net long/short positions and overall open interest.
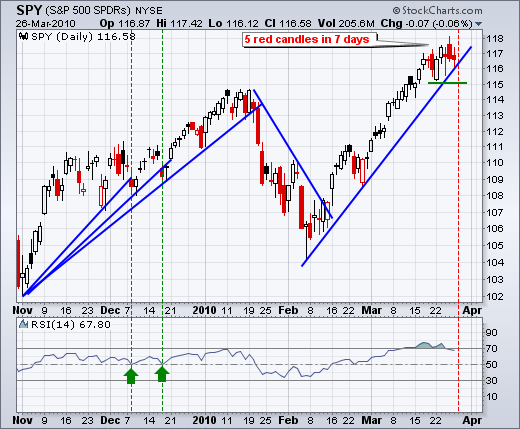
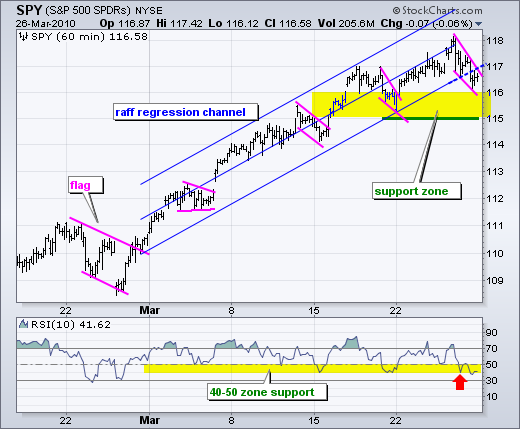
With these sentiment indicators showing excessive bullishness and the VIX trading near its Oct-07 and May-08 lows, risk of a pullback or consolidation continues to increase. Actually, SPY has been consolidating for seven days now. Timing can be a problem with sentiment indicators though. In particular, sentiment warnings can be early and the uptrend can continue during periods of excessive bullishness. This is why uptrends sometimes accelerate just before a pullback or correction. The current uptrend, overbought conditions and excessively bullish sentiment make it a risky period for both longs and shorts.
Economic reports due:
Tue - Mar 30 - 09:00 - Case-Shiller Index
Tue - Mar 30 - 10:00 - Consumer Confidence
Wed - Mar 31 - 08:15 - ADP Employment
Wed - Mar 31 - 09:45 - Chicago PMI
Wed - Mar 31 - 10:00 - Factory Orders
Wed - Mar 31 - 10:30 - Crude Inventories
Thu - Apr 01 - 08:30 - Initial Claims
Thu - Apr 01 - 10:00 - ISM Index
Thu - Apr 01 - 14:00 - Auto Sales
Fri - Apr 02 - 08:30 - Nonfarm Payrolls
Fri - Apr 02 - Stock Markets Closed
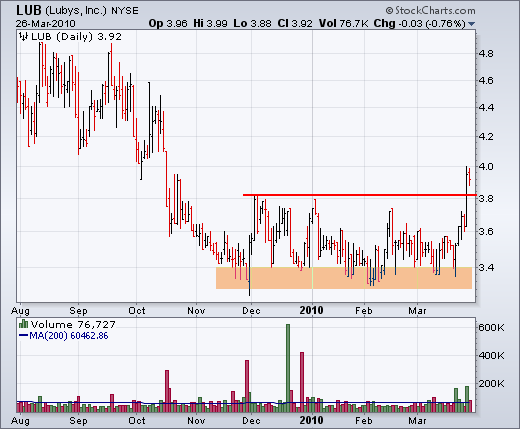
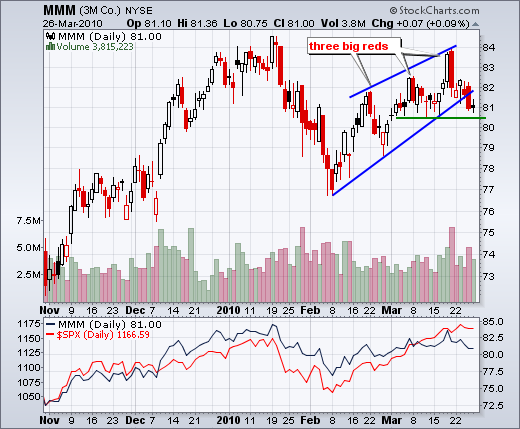
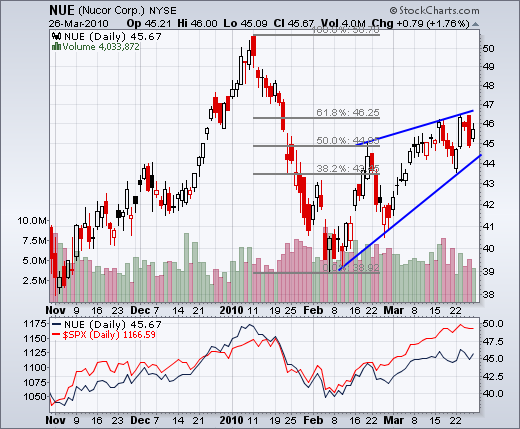
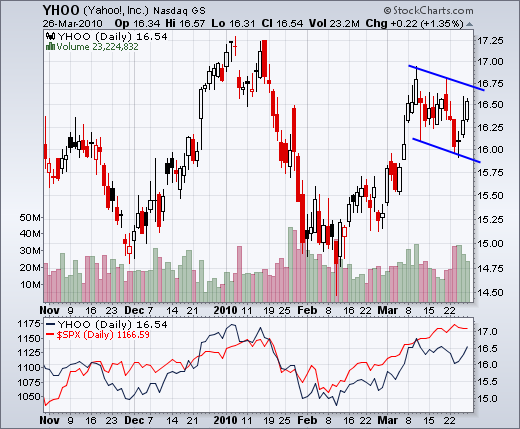
Charts of interest: LUB, MMM, NUE, YHOO
This commentary and charts-of-interest are designed to stimulate thinking. This analysis is not a recommendation to buy, sell, hold or sell short any security (stock ETF or otherwise). We all need to think for ourselves when it comes to trading our own accounts. First, it is the only way to really learn. Second, we are the only ones responsible for our decisions. Think of these charts as food for further analysis. Before making a trade, it is important to have a plan. Plan the trade and trade the plan. Among other things, this includes setting a trigger level, a target area and a stop-loss level. It is also important to plan for three possible price movements: advance, decline or sideways. Have a plan for all three scenarios BEFORE making the trade. Consider possible holding times. And finally, look at overall market conditions and sector/industry performance.

