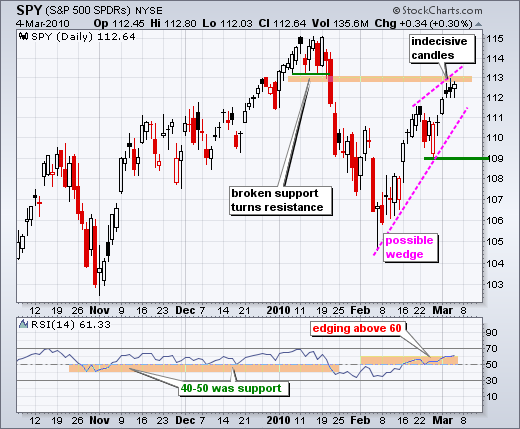
The S&P 500 ETF (SPY) stalled for the third day running as the ETF formed its third indecisive candlestick in a row. While this indecision can sometimes foreshadow a reversal, stalling is not the same as weakness. At this point, it is just a rest within the advance, which began in early February. It would take a long black candlestick to argue for an actual reversal. A rising wedge defines the four week uptrend with key support set at 109. RSI edged above 60 for the first time since January. As with SPY, RSI is also trending higher and I would mark momentum support at 50. A break below 50 would likely coincide with a trendline break in SPY.


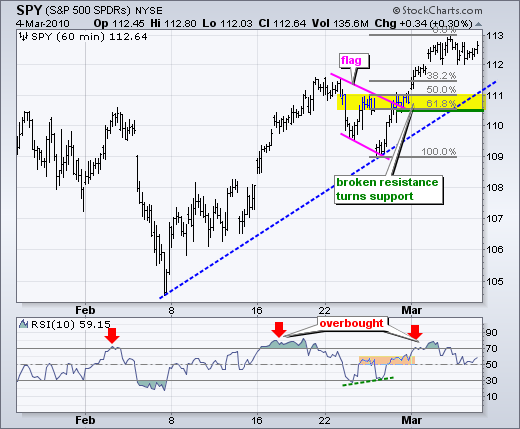
On the 60-minute chart, SPY broke flag resistance and this breakout is holding. The ETF surged above 112 and then stalled the last three days. There is even a minor support level at 112. Key support remains at 110.5. This area is marked by broken resistance and the 50-62% retracement zone. A break below this level would provide the first evidence of a short-term trend reversal. At this point, the next signal may depend on the reaction to the employment report. Perhaps I have built it up so much that reaction will be muted. Regardless of the report or the reaction, the trend is clearly up as long as short-term support holds.


About the author:
Arthur Hill, CMT, is the Chief Technical Strategist at TrendInvestorPro.com. Focusing predominantly on US equities and ETFs, his systematic approach of identifying trend, finding signals within the trend, and setting key price levels has made him an esteemed market technician. Arthur has written articles for numerous financial publications including Barrons and Stocks & Commodities Magazine. In addition to his Chartered Market Technician (CMT) designation, he holds an MBA from the Cass Business School at City University in London.
Learn More