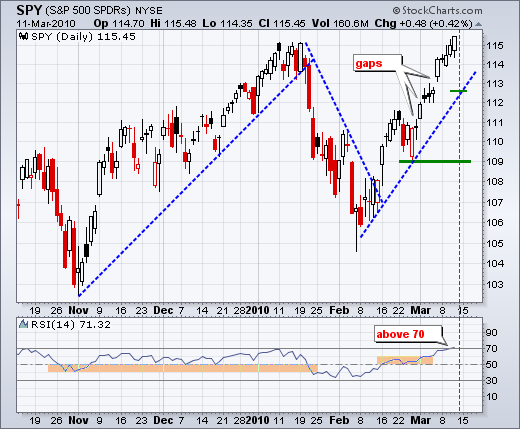
With Thursday's advance, the S&P 500 ETF (SPY) is now up 10 of the last 10 days and 19 of the last 24. This is an amazing string of advances. In fact, I would say it is starting to look like a melt-up, which is the opposite of a selling climax. With the close at 115.45, SPY has officially broken its January high and joins the elite club. The Dow Industrials, S&P 100 and NY Composite remain the three holdouts among the major indices. There is really no change on the chart. The trend up is up, strong and overbought. Yes, it can be all three. The blue dotted trendline defines the current upswing with last Thursday's gap now marking upswing support around 112.5. RSI moved above 70 for the first time since September 2009. This overbought reading did not mark a major top, but it did foreshadow a rather sharp pullback.

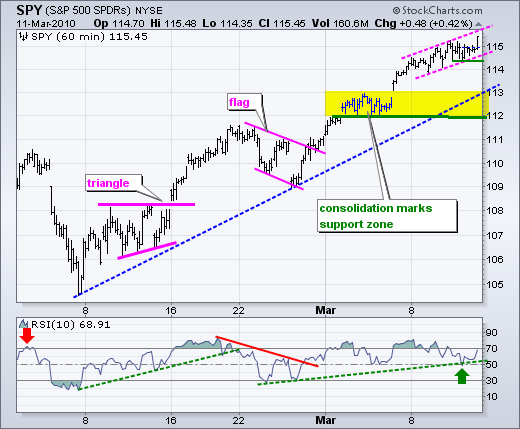
The 60-minute chart captures the current upswing. I am leaving upswing support at 112-113 for now. Since gapping up last Thursday, SPY worked its way higher within a rising channel this week. The first sign of weakness would be a break below channel support at 114.3. Notice how RSI bounced off the 50 zone to affirm momentum support. Look for a break below 50 as the first sign of weakening short-term momentum.
Charts of interest: AMAT, BBBY, LLTC, MHCP
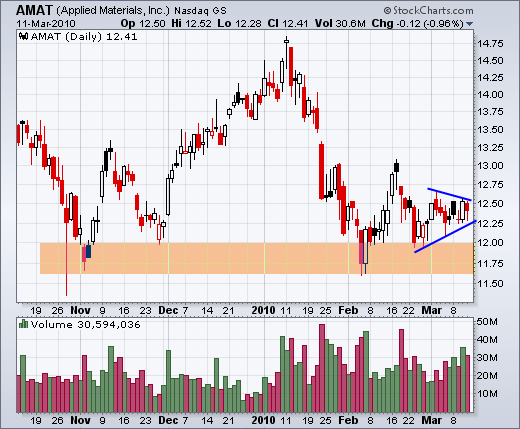
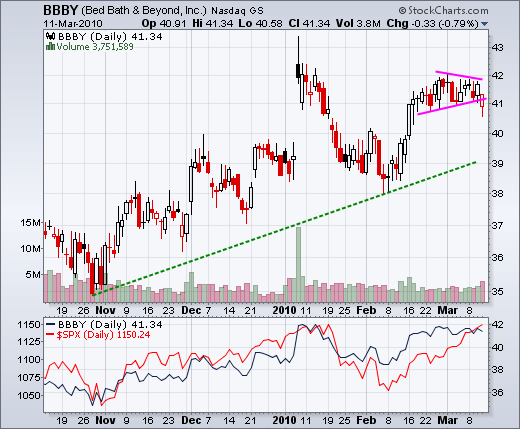
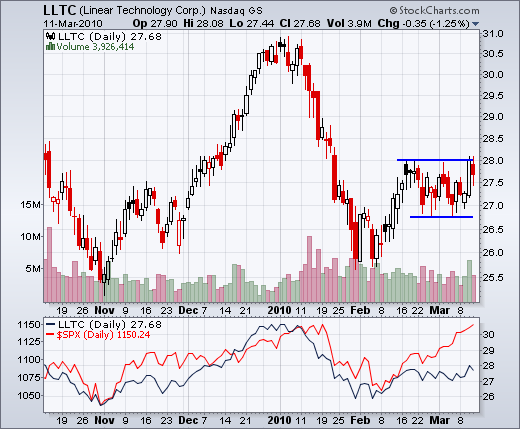
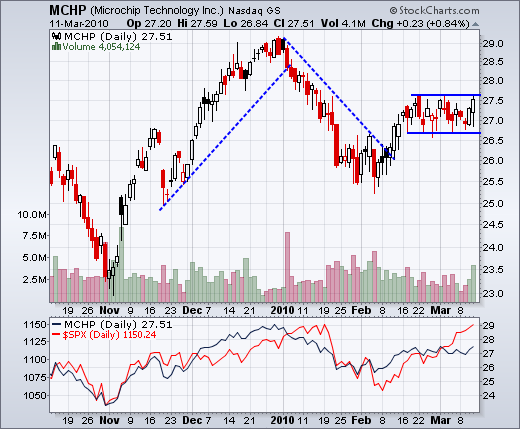

Charts of interest: AMAT, BBBY, LLTC, MHCP


About the author:
Arthur Hill, CMT, is the Chief Technical Strategist at TrendInvestorPro.com. Focusing predominantly on US equities and ETFs, his systematic approach of identifying trend, finding signals within the trend, and setting key price levels has made him an esteemed market technician. Arthur has written articles for numerous financial publications including Barrons and Stocks & Commodities Magazine. In addition to his Chartered Market Technician (CMT) designation, he holds an MBA from the Cass Business School at City University in London.
Learn More