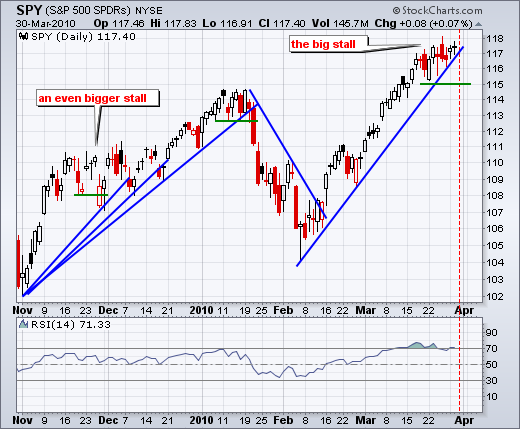
On the 60-minute chart, SPY broke flag/wedge resistance and the breakout is holding. However, the ETF has yet to follow through on the breakout. SPY simply stalled around 117 the last two days. A move below Monday's low (116.6) would be the first hint of weakness. Key support remains at 116 and a break below this level would argue for a short-term trend reversal that could start a correction. RSI remains near uptrend support in the 40-50 zone. A break below 40 would turn short-term momentum bearish.

The economic docket is full this week and we have a short trading week with the Good Friday holiday. The employment report will be reported on Friday, but the stock market will have to wait until Monday for a reaction.
Economic reports due:
Wed - Mar 31 - 08:15 - ADP Employment
Wed - Mar 31 - 09:45 - Chicago PMI
Wed - Mar 31 - 10:00 - Factory Orders
Wed - Mar 31 - 10:30 - Crude Inventories
Thu - Apr 01 - 08:30 - Initial Claims
Thu - Apr 01 - 10:00 - ISM Index
Thu - Apr 01 - 14:00 - Auto Sales
Fri - Apr 02 - 08:30 - Nonfarm Payrolls
Fri - Apr 02 - Stock Markets Closed
Charts of interest: CTXS, COST, DISH, KLAC, XRAY


This commentary and charts-of-interest are designed to stimulate thinking. This analysis is not a recommendation to buy, sell, hold or sell short any security (stock ETF or otherwise). We all need to think for ourselves when it comes to trading our own accounts. First, it is the only way to really learn. Second, we are the only ones responsible for our decisions. Think of these charts as food for further analysis. Before making a trade, it is important to have a plan. Plan the trade and trade the plan. Among other things, this includes setting a trigger level, a target area and a stop-loss level. It is also important to plan for three possible price movements: advance, decline or sideways. Have a plan for all three scenarios BEFORE making the trade. Consider possible holding times. And finally, look at overall market conditions and sector/industry performance.


