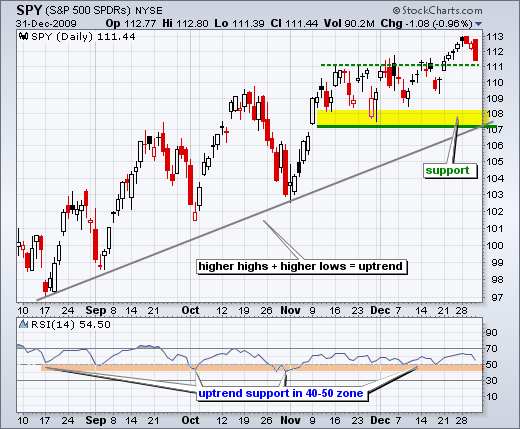
SPY affirmed its uptrend with a break above consolidation resistance at 111 just before Christmas and a new 52-week high last week. The ETF was holding above 112 on New Year's Eve, but late selling pressure pushed SPY below 111.5 by the close. Even though a long red candlestick and bearish engulfing pattern formed, I would not read too much into this weakness. First, it occurred in the final hour of 2009 with thin trading. Second, the overall trend is clearly up on the daily chart. Broken resistance around 111 now turns into the first support level to watch. Key support remains in the 107-108 area.

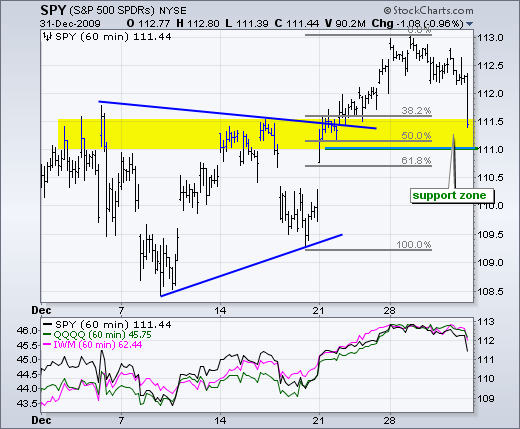
On the 60-minute chart, the broken resistance zone around 111-111.5 turns into a support zone. With Thursday's late sell off, SPY ended the year at the top of this support zone. Support in this area is also confirmed by the 38-50% retracement zone. Even though retracements can conceivably extend to the 62% mark, a shallow pullback would be more bullish than a deep pullback. Failure to hold support at 111 would argue for a deeper pullback.

The economic docket is pretty full this week. Construction spending and the ISM Index are due Monday at 10AM ET. Factory Orders and Pending Home Sales are scheduled for Tuesday. Wednesday features the ADP Employment report and ISM Services Index. Thursday deals with Crude Inventories and Initial Claims. Friday is reserved for the granddaddy of them all, the employment report. In the December 4th employment report, November non-farm payrolls fell just 11,000, which was much better-than-expected. Even though it was just one month that is subject to revision, the surprise weighed on bonds throughout December and perhaps propped up the stock market. Another better-than-expected employment report could extend on bond weakness and stock strength. Look for early clues with the ADP Report Wednesday and Initial Claims on Thursday.


