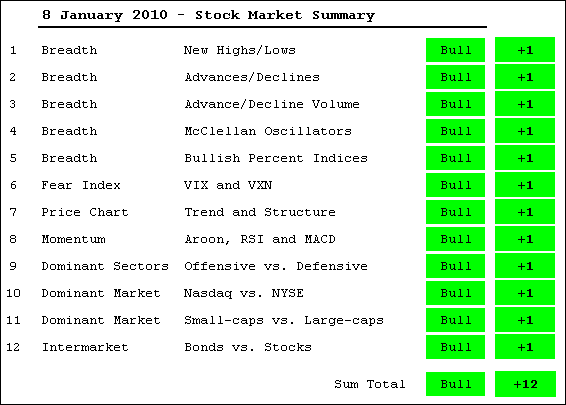
The bulk of the medium-term evidence remains bullish for stocks. Commentary featuring some of these indicators can be found in the Market Message later today.
There is a brief run down of the 12 indicator groups after the jump. Updated breadth charts can be found on the breadth charts page.
-Net New Highs expanded in December-January-Nasdaq AD Line is lagging, but NYSE AD Line hit a new high this week
-The Nasdaq and NYSE AD Volume Lines hit new highs this week
-Both McClellan Oscillators surged above +50 in late December
-All Bullish Percent Indices are above 50%
-Volatility is low as $VIX and $VXN hit new lows in January
-DIA, IWM, QQQQ and SPY hit new reaction highs this year0
-XLY, XLI and XLK hit new reaction highs this year
-XLF surged over the last four days
-Small-caps are leading large-caps
-The Nasdaq is leading the NY Composite
-Bonds are falling and interest rates are rising

About the author:
Arthur Hill, CMT, is the Chief Technical Strategist at TrendInvestorPro.com. Focusing predominantly on US equities and ETFs, his systematic approach of identifying trend, finding signals within the trend, and setting key price levels has made him an esteemed market technician. Arthur has written articles for numerous financial publications including Barrons and Stocks & Commodities Magazine. In addition to his Chartered Market Technician (CMT) designation, he holds an MBA from the Cass Business School at City University in London.
Learn More
