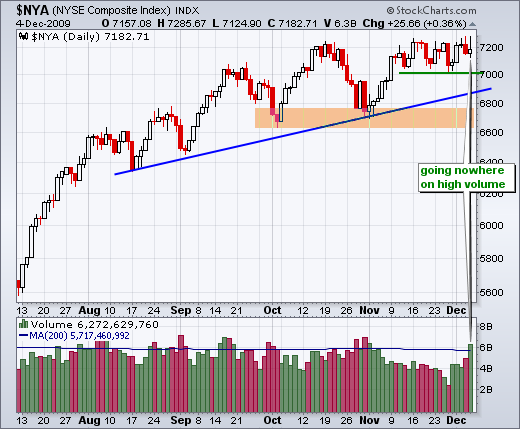
Despite closing up on the day, I was not impressed with Friday's price action. A surprisingly small decline (-11K) in non-farm payrolls prompted the bulls into action as SPY opened around 111.84. These gains were fleeting as SPY declined to 110.04 in late morning. Even though afternoon buying pushed the market back into positive territory by the close, the overall gains were not impressive, especially after the morning gaps. All of the major indices were up on the day, but the Nasdaq was up less than 1% and the NY Composite was up just .36%. Nasdaq and NYSE volume levels were the highest since November 2nd, but Friday's price action was indecisive. Indecision on high volume can sometimes foreshadow a short-term reversal. Also note that only five of the nine sectors finished positive and only two gained over 1% on the day (industrials and finance).


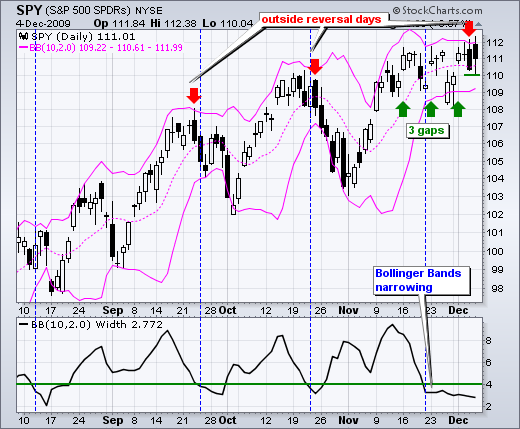
Turning to the S&P 500 ETF (SPY) chart, the ETF formed an outside reversal with a long black candlestick on Thursday and another black candlestick on Friday. This means SPY closed below the open two days in a row. Nevertheless, the third gap is still holding as SPY trades near resistance around 111-112. It has been one heck of a battle the last three weeks as SPY closed 111 at least six times in the last 14 days. A move below 110 would fill the third gap and be the first sign of material weakness. Failure to follow through on Friday's employment report (good news) would be quite negative.

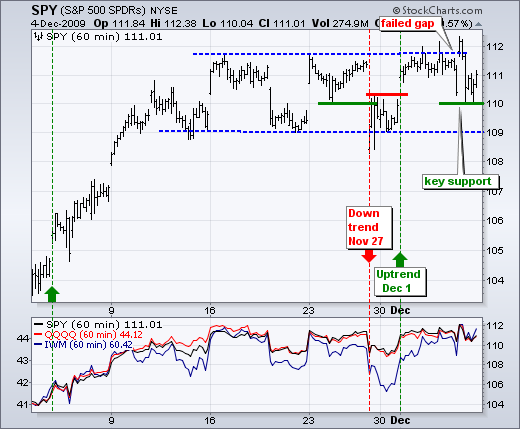
The 60-minute chart affirms the importance of support at 110. Yes, I am going on a limb again by raising short-term support to 110, which is still within the trading range. I did this in late November, but the support break at 110 did not hold. However, I think the failure to hold the breakout at 112 is a sign of weakness.


The 60-minute chart affirms the importance of support at 110. Yes, I am going on a limb again by raising short-term support to 110, which is still within the trading range. I did this in late November, but the support break at 110 did not hold. However, I think the failure to hold the breakout at 112 is a sign of weakness.


About the author:
Arthur Hill, CMT, is the Chief Technical Strategist at TrendInvestorPro.com. Focusing predominantly on US equities and ETFs, his systematic approach of identifying trend, finding signals within the trend, and setting key price levels has made him an esteemed market technician. Arthur has written articles for numerous financial publications including Barrons and Stocks & Commodities Magazine. In addition to his Chartered Market Technician (CMT) designation, he holds an MBA from the Cass Business School at City University in London.
Learn More