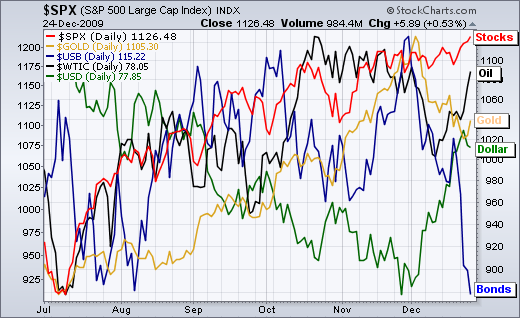
-Bonds breakdown as stocks hit new high
-Dollar getting short-term overbought
-Gold finds support near broken resistance
-Oil recovers after early December drop
-Bonds break support with sharp decline
-Dollar getting short-term overbought
-Gold finds support near broken resistance
-Oil recovers after early December drop
-Bonds break support with sharp decline

*****************************************************************
Dollar getting short-term overbought
After a big surge the last four weeks, the US Dollar Index ($USD) is short-term overbought and near its first resistance zone. On the daily chart, the index broke above its early November and early October highs with a move above 78. There is resistance in the 78-80 area from the August consolidation and the index is overbought after a 5% advance from low to high. This is a huge move for the Dollar index. In fact, this move is comparable to the sharp March decline, which triggered a 9 month downtrend. I think this surge was strong enough to trigger the start of an extended uptrend for the greenback.
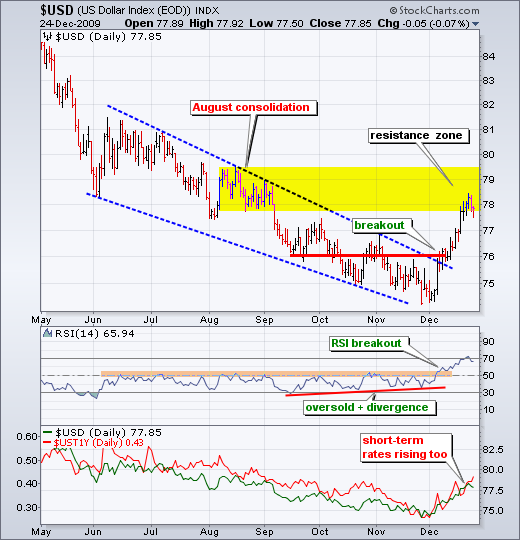
On a fundamental note, a rise in short-term interest rates supports the advance in the Dollar. The bottom indicator window shows the 1-Year Treasury Yield ($UST1Y) bottoming at the end of November and rising the last four weeks. There is clearly a positive correlation between short-term interest rates and the Dollar. This bounce in short-term rates suggests that the Fed will raise rates sometime in 2010. The bond market usually moves well ahead of the Fed. It is also worth noting that stocks held up even when the Dollar surged. It appears that the stocks-down dollar-up relationship has ended.
*****************************************************************
Strong Dollar challenges gold
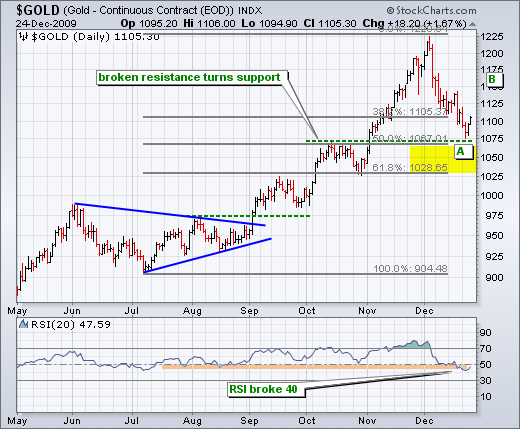
The bullion bulls are getting a stiff challenge from the trend reversal in the Dollar. In fact, it is hard to justify being bullish gold and bullish the Dollar at the same time. Given the breakout in the Dollar and the prospects of an extended advance, the Gold-Continuous Futures ($GOLD) could correct back to the 1000 area over the next few months. Keep in mind that gold advanced from 900 to 1225 without much of a correction (July to November). Corrections can extend 38% to 62%. A 62% correction would extend to around 1025. After a decline to around 1075, gold found support near broken resistance and the 50% retracement mark. There was a small bounce that could be part of an ABC correction. Wave A marks the first decline, Wave B would be an oversold bounce towards 1040-1050 and Wave C would be a decline to the 62% retracement around 1025. ABC corrections are part of Elliott Wave theory. Wave A and Wave C are sometimes equal. Wave B can sometimes retrace 38-62% of Wave A.
*****************************************************************
Oil recovers with strong bounce
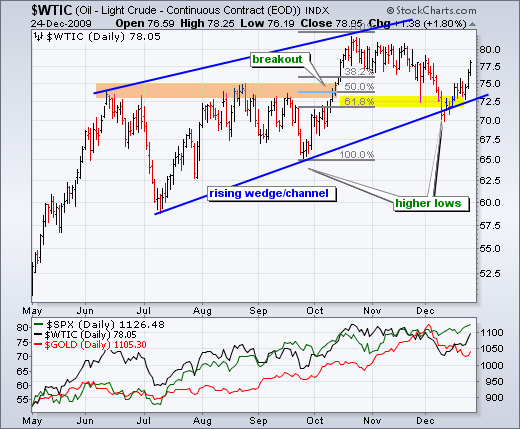
The West Texas Intermediate ($WTIC) shook off a sharp decline in early December and surged above 77.5 last week. Taking a step back and working from left to right on the chart, we can see a breakout at 75 in mid October. The blue trendlines also show a rising channel or wedge with higher highs and higher lows. Breakouts, higher highs and higher lows mean the big trend is up. The sharp decline in early December threw a real curve ball to the bulls, but oil managed to reverse near the 62% retracement and surge back above 75. With another higher low forming in early-mid December, I must consider the trend up for oil and expect higher prices until there is a reversal.
*****************************************************************
Bonds in bad shape
December was a bad month for bonds. It all started with better-than-expected employment report on December 4th (Friday). Non-farm payrolls declined by 11,000 in November, which was much better-than-expected. The Fed is unlikely to raise rates as long as non-farm payrolls and the employment report fall. November's surprise just increased the odds of a rate hike sometime in 2010. The next employment rate is scheduled for January 8th (a Friday) before the open. Another upside surprise would be further bearish for bonds.
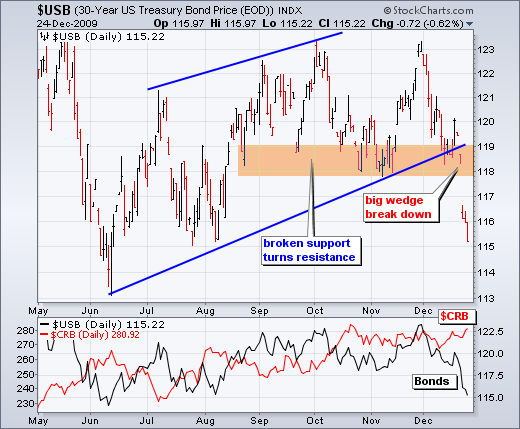
On the price chart, the 30-year Treasury Bond ($USB) broke rising wedge support with a sharp decline last week. This break signals a continuation of the December-June decline, which was from 142.5 to 113. The 2008 lows mark support at 112.5 and the 2007 low marks support around 105. Bonds are already getting oversold after a 6% decline in four weeks. Broken support around 118-119 now turns into a resistance zone. The bottom indicator window shows bonds with the CRB Index ($CRB). This commodity index is trading near its October-November highs. Such strength in commodities is also negative for bonds overall.
*****************************************************************
Dollar getting short-term overbought
After a big surge the last four weeks, the US Dollar Index ($USD) is short-term overbought and near its first resistance zone. On the daily chart, the index broke above its early November and early October highs with a move above 78. There is resistance in the 78-80 area from the August consolidation and the index is overbought after a 5% advance from low to high. This is a huge move for the Dollar index. In fact, this move is comparable to the sharp March decline, which triggered a 9 month downtrend. I think this surge was strong enough to trigger the start of an extended uptrend for the greenback.

On a fundamental note, a rise in short-term interest rates supports the advance in the Dollar. The bottom indicator window shows the 1-Year Treasury Yield ($UST1Y) bottoming at the end of November and rising the last four weeks. There is clearly a positive correlation between short-term interest rates and the Dollar. This bounce in short-term rates suggests that the Fed will raise rates sometime in 2010. The bond market usually moves well ahead of the Fed. It is also worth noting that stocks held up even when the Dollar surged. It appears that the stocks-down dollar-up relationship has ended.
*****************************************************************
Strong Dollar challenges gold
The bullion bulls are getting a stiff challenge from the trend reversal in the Dollar. In fact, it is hard to justify being bullish gold and bullish the Dollar at the same time. Given the breakout in the Dollar and the prospects of an extended advance, the Gold-Continuous Futures ($GOLD) could correct back to the 1000 area over the next few months. Keep in mind that gold advanced from 900 to 1225 without much of a correction (July to November). Corrections can extend 38% to 62%. A 62% correction would extend to around 1025. After a decline to around 1075, gold found support near broken resistance and the 50% retracement mark. There was a small bounce that could be part of an ABC correction. Wave A marks the first decline, Wave B would be an oversold bounce towards 1040-1050 and Wave C would be a decline to the 62% retracement around 1025. ABC corrections are part of Elliott Wave theory. Wave A and Wave C are sometimes equal. Wave B can sometimes retrace 38-62% of Wave A.

*****************************************************************
Oil recovers with strong bounce
The West Texas Intermediate ($WTIC) shook off a sharp decline in early December and surged above 77.5 last week. Taking a step back and working from left to right on the chart, we can see a breakout at 75 in mid October. The blue trendlines also show a rising channel or wedge with higher highs and higher lows. Breakouts, higher highs and higher lows mean the big trend is up. The sharp decline in early December threw a real curve ball to the bulls, but oil managed to reverse near the 62% retracement and surge back above 75. With another higher low forming in early-mid December, I must consider the trend up for oil and expect higher prices until there is a reversal.

*****************************************************************
Bonds in bad shape
December was a bad month for bonds. It all started with better-than-expected employment report on December 4th (Friday). Non-farm payrolls declined by 11,000 in November, which was much better-than-expected. The Fed is unlikely to raise rates as long as non-farm payrolls and the employment report fall. November's surprise just increased the odds of a rate hike sometime in 2010. The next employment rate is scheduled for January 8th (a Friday) before the open. Another upside surprise would be further bearish for bonds.

On the price chart, the 30-year Treasury Bond ($USB) broke rising wedge support with a sharp decline last week. This break signals a continuation of the December-June decline, which was from 142.5 to 113. The 2008 lows mark support at 112.5 and the 2007 low marks support around 105. Bonds are already getting oversold after a 6% decline in four weeks. Broken support around 118-119 now turns into a resistance zone. The bottom indicator window shows bonds with the CRB Index ($CRB). This commodity index is trading near its October-November highs. Such strength in commodities is also negative for bonds overall.
*****************************************************************

About the author:
Arthur Hill, CMT, is the Chief Technical Strategist at TrendInvestorPro.com. Focusing predominantly on US equities and ETFs, his systematic approach of identifying trend, finding signals within the trend, and setting key price levels has made him an esteemed market technician. Arthur has written articles for numerous financial publications including Barrons and Stocks & Commodities Magazine. In addition to his Chartered Market Technician (CMT) designation, he holds an MBA from the Cass Business School at City University in London.
Learn More