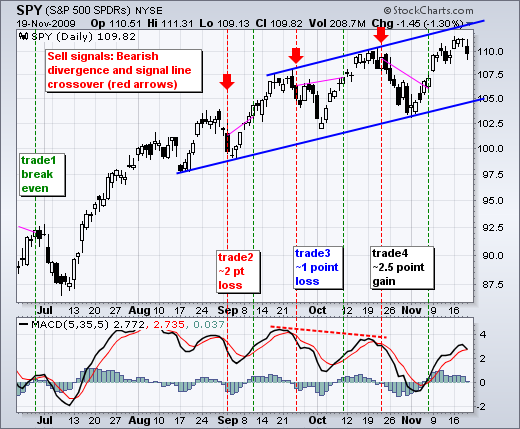
There is an interesting pattern taking shape on the daily charts of the major index ETFs. In September and October, notice how SPY advanced in the first half of the month and fell in the second half of the month. This is also the case for DIA, IWM and QQQQ. Most recently, SPY advanced in the first half of November, stalled mid week and declined on Thursday. Should the split-month pattern and rising channel continue to play out, we can expect a pullback towards 105 over the next two weeks.

The bottom indicator window shows SPY with MACD (5,35,5). A short-term sell signal is triggered with a bearish divergence and signal line crossover. So far there have been four completed signals: one breakeven trade, two small losses and one modest gain. With MACD forming another bearish divergence in Oct-Nov and rolling over yesterday, it is on the verge of crossing below its signal line for another bearish signal. Note that these are only considered short-term signals. We have seen three bearish divergences since September, but the medium-term up trend continues.

About the author:
Arthur Hill, CMT, is the Chief Technical Strategist at TrendInvestorPro.com. Focusing predominantly on US equities and ETFs, his systematic approach of identifying trend, finding signals within the trend, and setting key price levels has made him an esteemed market technician. Arthur has written articles for numerous financial publications including Barrons and Stocks & Commodities Magazine. In addition to his Chartered Market Technician (CMT) designation, he holds an MBA from the Cass Business School at City University in London.
Learn More