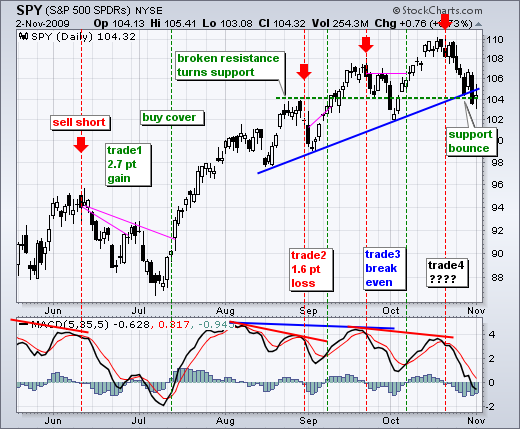
SPY formed a spinning top to signal indecision on Monday. Perhaps more importantly, the ETF surged above 105 in early trading and failed to hold these gains. The inability to hold early gains shows weakness. Buyers were not strong enough to hold gains. Sellers were strong enough to push prices back down. On the daily chart, SPY is trading just above its early October low hold. A move below this level would forge a lower low and signal the start of a medium-term downtrend. The bottom indicator window shows MACD (5,35,5) still below its signal line. Also notice that MACD moved into negative territory for the first time since mid June.
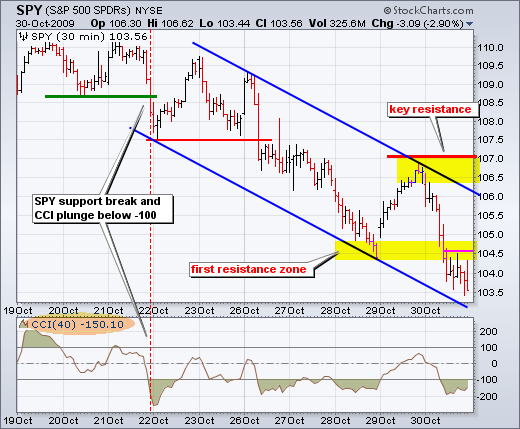
The 30-minute chart shows a clear and present downtrend. SPY bounced above 105 in early trading, but fell back below 104 in the early afternoon. With a new reaction high, I am lowering key resistance to 105.5. It would take a move above this level to reverse the short-term downtrend. I would also look for confirmation with a CCI break above +100. Even though this short-term downtrend is getting overextended, lower prices are expected until the trend actually reverses.


