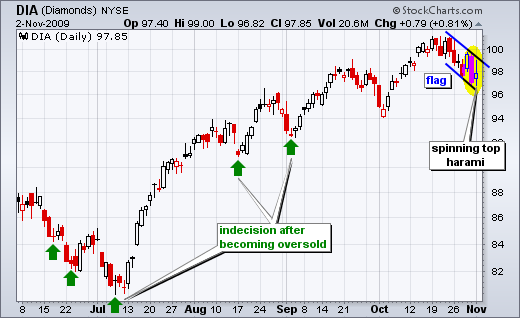
-DIA forms spinning top and bull flag.
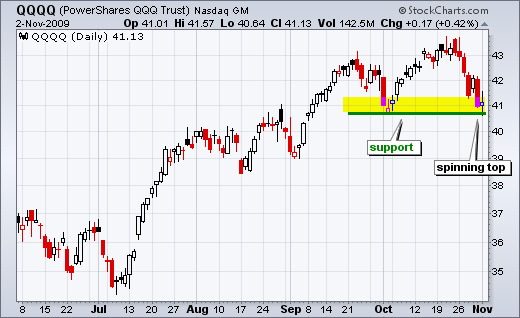
-QQQQ forms spinning top at support.
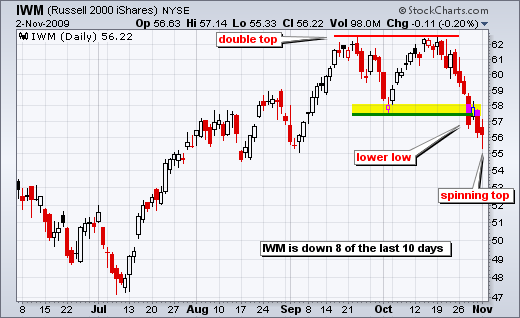
-IWM forms spinning top below support break.
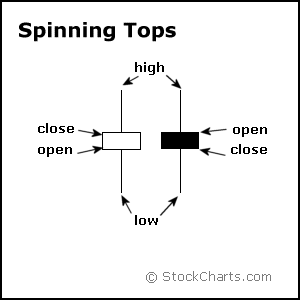
On the daily charts, the major index ETFs finished with spinning top candlesticks on Monday. These show indecision that could foreshadow a short-term bounce. Spinning tops form when the open is near the close and there is a wide high-low range. Despite a lot of movement during the day (high-low range), the major index ETFs settled near their opening levels, resulting in little change from open to close. The bulls pushed the market higher in early trading, the bears drove it down in the afternoon and the market bounced in the last two hour of trading. Not much to show for a whole lot of pushing and shoving.
DIA also formed a bull flag over the last two weeks. Technically, a break above 100 would be bullish and signal a continuation higher. Using traditional technical analysis techniques, the upside target would be around 104. However, I have my doubts on the sustainability of a breakout at this stage of the ballgame. We can judge the strength of a potential breakout by what happens after the breakout. Strong breakouts hold and prices continue higher. A quick throw back below 99 would show hesitancy that would question strength.
QQQQ formed a spinning top at support on Monday.
IWM formed a spinning top below support on Monday. As the only major index ETF to break below support, IWM shows relative weakness.


