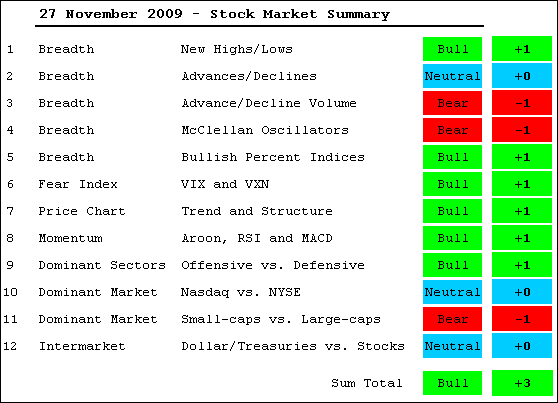
Note that current evidence does not include Friday's trading. The S&P 500 is down around 3% in pre-market trading. This move could be an overreaction in thin trading or more. I will review the table and indicators on Monday as well. Despite some bearish indicators and lagging areas of the market, the bulk of the evidence remains bullish. The bearish indications include relative weakness in small-caps and the finance sector. In addition, the AD Volume Lines both broke support and remain below their October highs. With lower highs, bearish divergences are forming in these key breadth indicators. Net New Highs remain positive, but there were fewer new 52-week highs in November. It appears that participation in the advance in narrowing, which can foreshadow a market top.
Despite signs of narrowing participation, there is enough bullish evidence to override these negatives. Three of the hour major index ETFs recorded new reaction highs in November. This means the overall trend is clearly up. In addition, three of the four offensive sectors recorded new reaction highs in November. The S&P 500 Volatility Index ($VIX) and Nasdaq 100 Volatility Index ($VXN) are testing their October lows and remain in clear downtrends. The Dollar is trending lower and has been negatively correlated with the S&P 500 since March. And finally, all of the Bullish Percent Indices remain above 50%. These items will all be covered in detail in the video.

About the author:
Arthur Hill, CMT, is the Chief Technical Strategist at TrendInvestorPro.com. Focusing predominantly on US equities and ETFs, his systematic approach of identifying trend, finding signals within the trend, and setting key price levels has made him an esteemed market technician. Arthur has written articles for numerous financial publications including Barrons and Stocks & Commodities Magazine. In addition to his Chartered Market Technician (CMT) designation, he holds an MBA from the Cass Business School at City University in London.
Learn More
