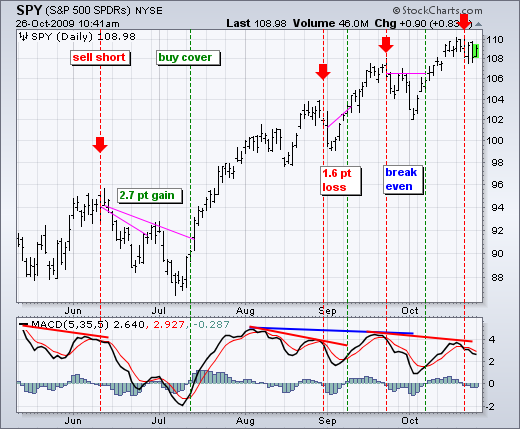
This is just a quick update on the short-term trend for SPY and last week's MACD signal. On the daily chart, MACD(5,35,5) formed a bearish divergence and moved below its signal line last Wednesday for a bearish signal. MACD remains below its signal line, which means momentum is deteriorating. Put another way, the 5-day EMA is moving lower.
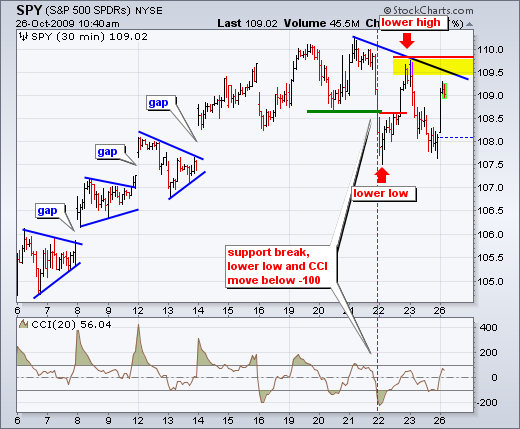
On the 30-minute chart, SPY broke support with a sharp decline last Wednesday. Despite a big surge on Thursday, SPY failed to break above its prior high and moved lower on Friday. A lower high formed to signal the start of a short-term downtrend. With the medium-term trend still up, it is difficult to estimate the length and duration of this short-term decline. The medium-term uptrend is still bigger and could ultimately prevail. Be careful. I see a resistance zone around 109.5-110 (yellow area). A break above this resistance level would be short-term bullish.


