-Intermarket chart page updated (here)
-Short-Term SPY analysis in separate post below
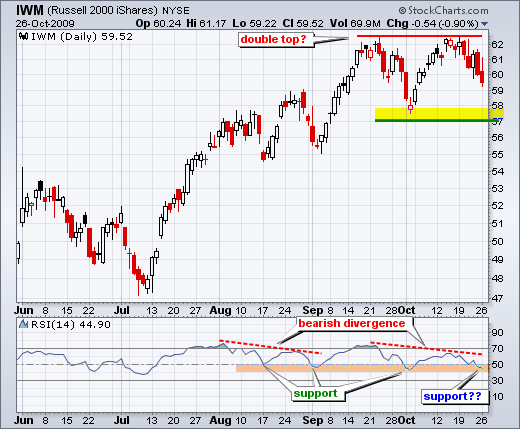
-Small-caps show relative weakness
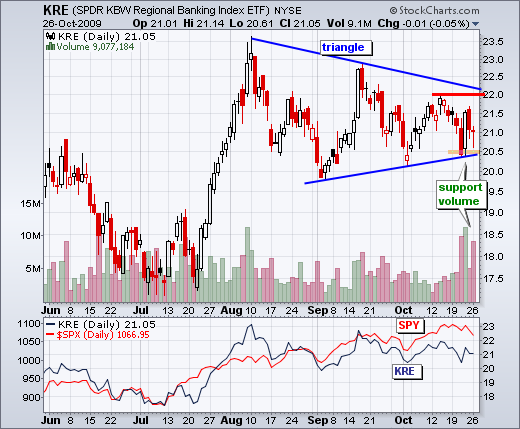
-Regional Banks hold support
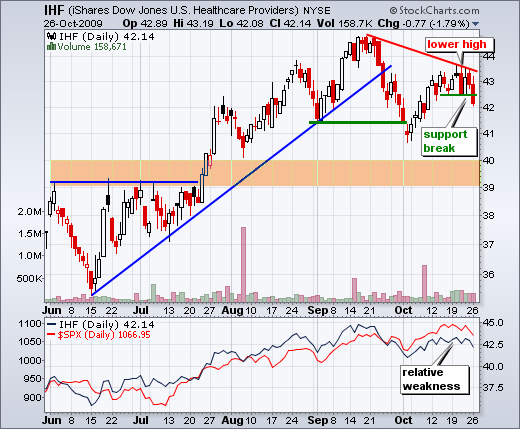
-Healthcare Providers ETF breaks support
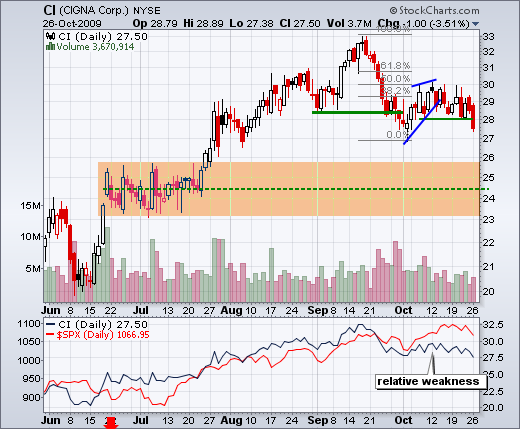
-Cigna shows relative weakness
-Semiconductors HOLDRS pullback after higher high
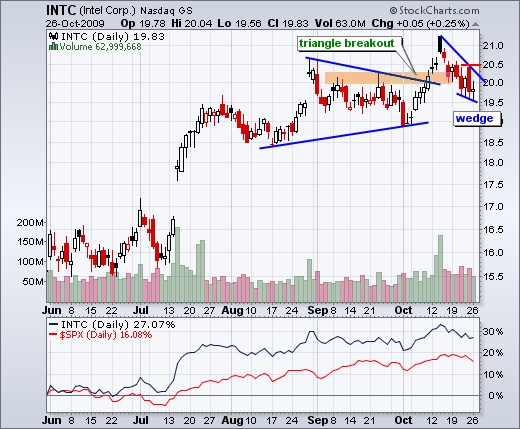
-Intel turns indecisive at key retracement
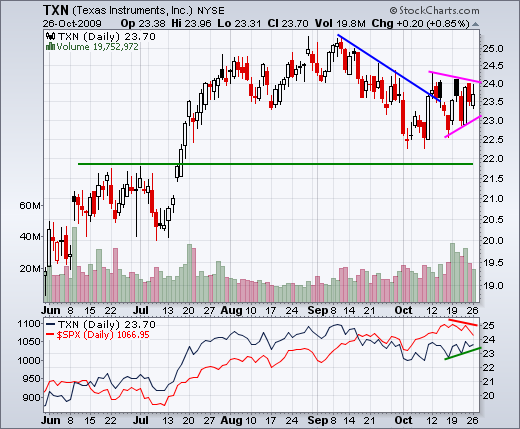
-Texas Instruments forms triangle consolidation
-Click here for the video page.
-Next Commentary: Short-term SPY update on Wed AM.
*****************************************************************
Small-caps Lagging
While the Dow Diamonds (DIA), S&P 500 ETF (SPY) and Nasdaq 100 ETF (QQQQ) moved above their September highs, the Russell 2000 ETF (IWM) failed to exceed its corresponding highs. On a closing basis, the highest October close was above the highest September close. However, on an intraday basis, the October high was below the September high. A simply visual inspection of this chart reveals that the October highs are close to the September highs. There is no clear breakout or higher high in October. The inability to forge a higher high with the other major index ETFs shows relative weakness. This is disconcerting because small-caps are like the canary in the coal mine. Small-caps often show weakness or strength ahead of the S&P 500. In other words, think of small-caps as a leading indicator.
The indicator window shows RSI with its second negative divergence in the last three months. The indicator moved into the 40-50 zone over the last few days. This is the make-or-break zone for the current uptrend. Notice how this zone offered support in mid August, early September and early October.
*****************************************************************
Regional Banks Hold Support
The Regional Bank SPDR (KRE) is engaged in a big tug-o-war near support. After a sharp decline last Wednesday, the ETF rebounded with a surge back to 21.5 on huge volume Thursday. KRE declined on Friday, but actually firmed on Monday with an indecisive candlestick on big volume. At this point, I will still err on the side of the bulls. Thursday's surge on big volume is still the biggest of all the moves. In addition, support around 20.5-21 is still holding. A break below last week's low would be bearish.
*****************************************************************
Healthcare Providers Feeling the Heat
The Healthcare Providers iShares (IHF) shows relative weakness with a lower high in October. In addition, the ETF broke short-term support with a sharp decline on Monday. With a lower high taking shape on this daily chart, a medium-term downtrend appears to be starting. The downside target would be the next support around 39-40.
I featured Cigna (CI) last week and the stock broke short-term support this week. Like IHF, Cigna appears to be starting another leg down with the next support zone around 24.5. Keep in mind that these stocks will continue to be influenced by healthcare reform in Washington.
*****************************************************************
SMH: A Pullback or Failed Breakout?
The Semiconductors HOLDRS (SMH) appeared to break resistance with a big surge in mid October, but this breakout failed to hold as the stock declined back below 25.5 over the last two weeks. Even though the "breakout" failed to hold, the ETF forged a higher high in October and remains above its early October low. Translation: the medium-term trend remains in place. Also notice that the decline over the last two weeks formed a falling wedge. Any guesses on how much of the prior decline this wedge retraced? The ETF firmed with an indecisive candlestick on high volume Monday. This is a start to finding support. Look for a move above Friday's high to break wedge resistance and reverse the two week downtrend.
*****************************************************************
TXN and INTC Hold the Key to SMH
As the biggest components in SMH, Intel (INTC) and Texas Instruments (TXN) hold the key. After surging above 23.5, TXN formed a triangle consolidation over the last two weeks. Notice that upside volume (green bars) has been stronger than downside volume (red bars). A break above last week's high would be bullish.
Intel (INTC) broke triangle resistance with a surge above 20.5 in early October. Despite this high-volume breakout, the stock pulled back below 20 over the last two weeks. This pullback retraced around 62% of the October surge and the stock is finding support in the 19.5-20 area. Also notice that a spinning top formed on Monday. This candlestick shows indecision that also confirms support.
*****************************************************************
Thanks for tuning in and have a great day!
*****************************************************************

