-Medium-term evidence remains bullish
-Wave 4 Hits the 50% Retracement
-Key Supports for SPY, QQQQ and IWM
-SPY is Already Short-term Oversold
-Volatility Indices Surge to Resistance
-Momentum Indicators Remain Bullish Overall
-McClellan Oscillators Turn Bearish
-Stocks and Bonds Disconnect
-China and Japan Lag
-Stocks: ADSK, AMZN, ANF, INTC, PENN and SHLD
-Click here for the video page.
-Next update: Tuesday, October 6th around 7AM ET.
*****************************************************************
Medium-term Evidence Remains Bullish
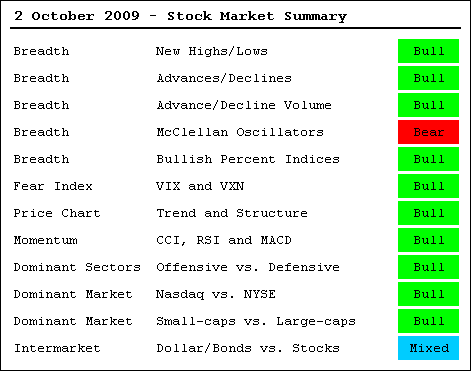
The bulk of the medium-term evidence remains bullish, but the short-term trends are down after this weeks' sharp decline. At this point, short-term weakness has not been enough to overturn the medium-term evidence. Even though this will happen one week, we can never be sure exactly when it will happen. The majority of indicators are still in bull mode, but some of are at make-or-break levels. These include the volatility indices, the momentum oscillators and the intermarket relationships. I will review these make-or-break indicators in the sections below. After seven days of increased selling pressure, another seven days would likely be enough to turn this medium-term evidence bearish. But let's not get ahead of ourselves. This evidence table is designed to be followed, not predicted. The current evidence has favored the bull since mid July. That's a pretty good run, but the table is not perfect. There was a whipsaw as the evidence turned bearish in early July, but flipped back to the bulls after the July surge.
*****************************************************************
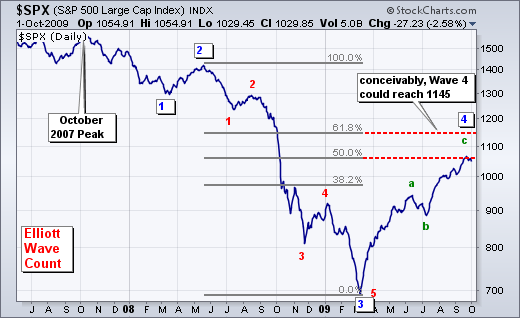
Wave 4 Hits Resistance
The long-term wave count remains unchanged. With the pullback over the last seven days, SPY is meeting resistance near the 50% retracement mark. However, Wave 4 remains in play (up) as long as the bulk of the medium-term evidence stays bullish. This means Wave 4 could conceivably exceed 1100 before all is said and done. Should the medium-term evidence turn bearish, I would then consider the new downtrend as the start of Wave 5 down. Let's cross that bridge if/when it gets here. I also noted in Thursday's Market Message that the Technology SPDR (XLK), Consumer Discretionary SPDR (XLY) and Healthcare SPDR (XLV) were trading near retracement resistance on the weekly charts.
*****************************************************************
Marking Key Support on the Daily Charts
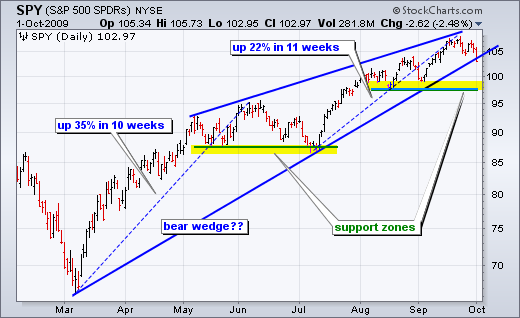
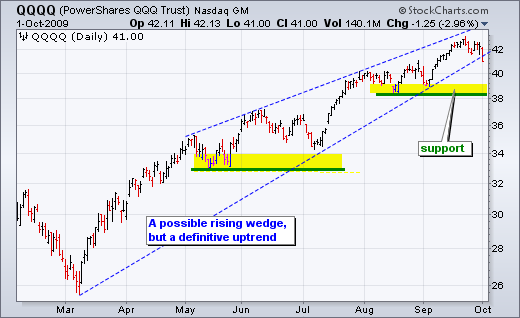
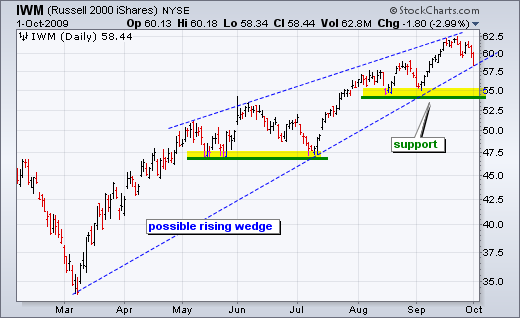
SPY, QQQQ and IWM all pulled back this week, but all three remain well above their August-September lows and in medium-term uptrends. Even though rising wedge patterns are taking shape, we should allow room for a pullback after the July-September advance. Over the prior 11 weeks, SPY gained around 22% without a correction. I am also a bit skeptical of the rising wedge because the lower trendlines look too steep. These trendlines are based on selling climaxes in March and sharp "V" bottoms. Such bottoms always lead to trendlines that are too steep. In any case, a definitive trend reversal would not occur unless all three break their August-September lows.
*****************************************************************
Short-term Oversold Already
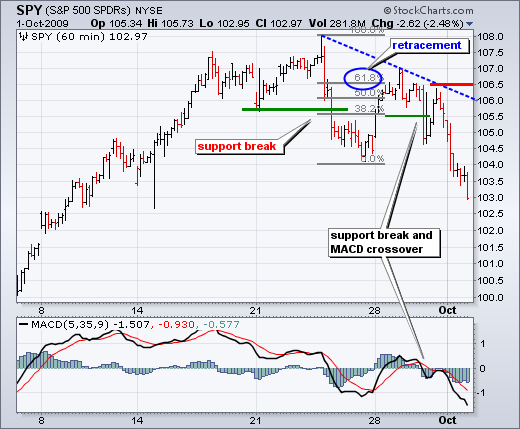
As long as the medium-term evidence favors the bulls, short-term downtrends could be, well, short lived. For short-term traders, the time to go short has already passed, in my humble opinion. In Tuesday's commentary, I showed the 60-minute chart for SPY with support marked at 105.5 and MACD above its signal line. After meeting resistance near the 62% retracement, SPY broke below 105.5 with a sharp decline on Wednesday morning. Also notice that MACD (5,35,9) moved below its signal line and into negative territory. Even though SPY recovered on Wednesday, MACD remained below its signal line and in negative territory. MACD acted as a nice filter on this dead-cat bounce. At this point, short-term traders need to be careful because the market is short-term oversold and still medium-term bullish. Now may be the time to book partial profits and/or tighten stops. Short-term resistance is set at 106.5. These same techniques can be applied to QQQQ, IWM, DIA and other securities. Simply click on this chart to see the SharpChart settings and then change the symbol.
*****************************************************************
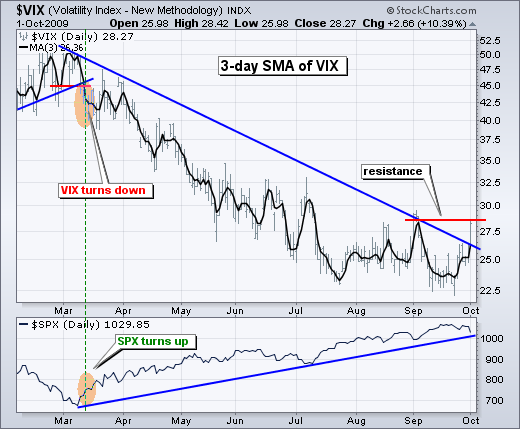
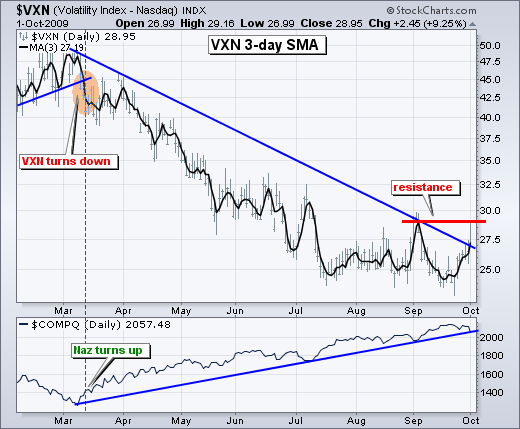
The S&P 500 Volatility Index ($VIX) and the Nasdaq 100 Volatility Index ($VXN) are challenging resistance from the August-September highs. Breakouts would be bullish for volatility and bearish for the stock market. As you can see from the charts, it would not take much for the 3-day SMAs to break resistance.
*****************************************************************
RSI Hits Potential Support Zone
Overall, the momentum oscillators still favor the bulls. RSI is the most sensitive of the three shown. With the dip below 50, RSI is the weakest it has been since July. The 40-50 zone is also the zone that produces reaction lows in RSI (when the bigger trend is up). This means we could see a short-term low soon. Barring a bounce, RSI could fully break down and turn bearish.
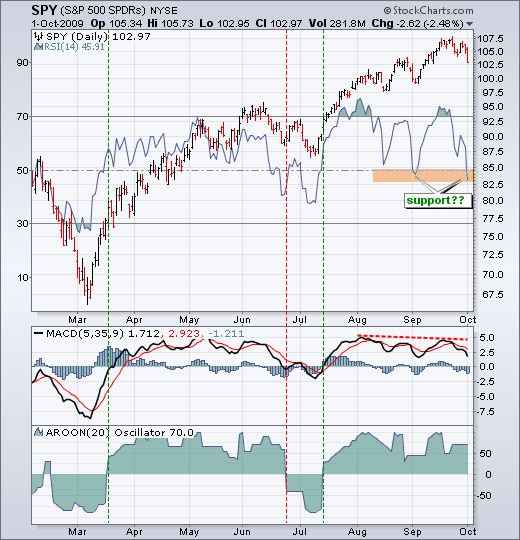
I also look at other momentum oscillators to get a consensus. MACD (5,35,9) formed a negative divergence and moved below its signal line. This is negative, but not outright bearish. We need a move into negative territory to turn MACD bearish. The Aroon Osillator remains in positive territory too and has yet to flip.
*****************************************************************
McClellan Oscillators Turn Bearish
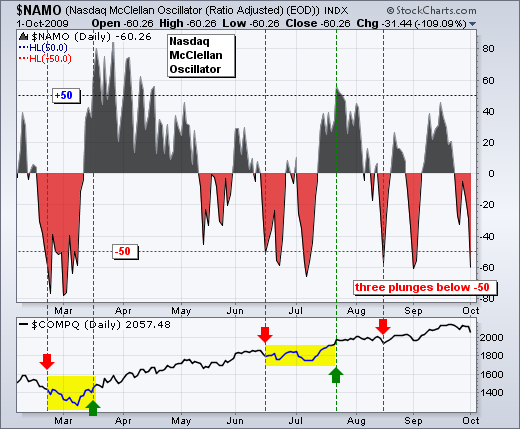
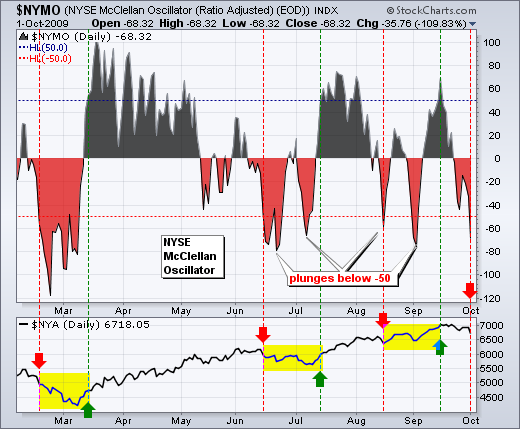
The McClellan Oscillators are back in bear mode as both plunged below -50 this week. As noted before, the Nasdaq McClellan Oscillator is like a momentum indicator of the Nasdaq AD Line. This makes the McClellan Oscillator an indicator of an indicator, which means it is two degrees removed from the actual Nasdaq Composite (the underlying security). As a momentum oscillator, it will produce more signals than both the AD Line and the Nasdaq. Turning back to the signal, the Nasdaq McClellan Oscillator has been in bear mode since first plunging below -50 in mid August. It take a move above +50 to reverse the signal. The NYSE McClellan Oscillator has flip-flopped the last several weeks with the latest flop below -50 putting it back in bear mode.
*****************************************************************
Bonds Do Not Agree With Stocks
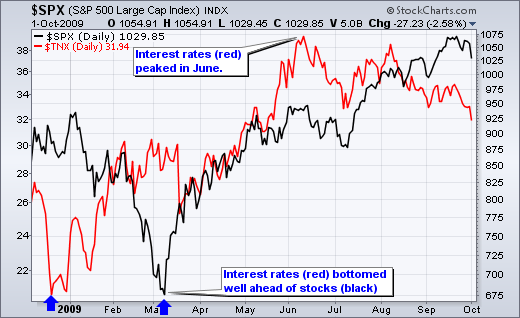
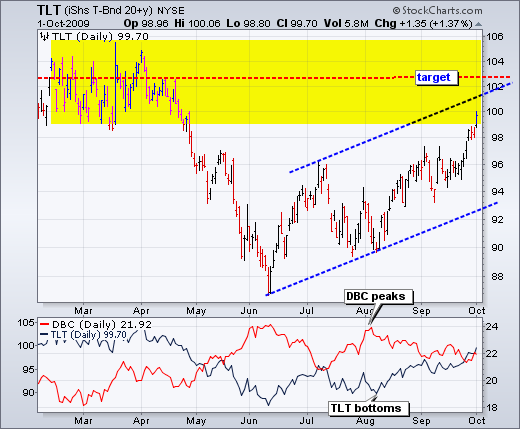
There is a disconnect between the stock market and the bond market. A strong stock market points to a strengthening economy, but a strong bond market points to a weakening economy. Something needs to give here. Bonds have been rising since early June, which means that interest rates have been falling. Remember, bonds and interest rates are inversely correlated. On the chart below, notice that interest rates bottomed in December 2008, about three months ahead of the stock market, which bottomed in March 2009. The early bottom in interest rates foreshadowed a rebound in the economy and stock market. Both rose from mid March until early June. With a move below the July low on Thursday, interest rates have been falling for over three months. This points to economic weakness, deflation or both. Needless to say, this would not be good for the stock market.
*****************************************************************
Asia Disconnects As Well
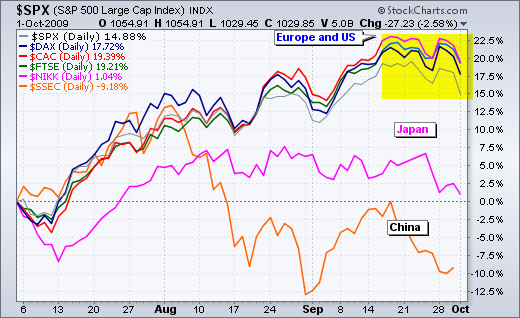
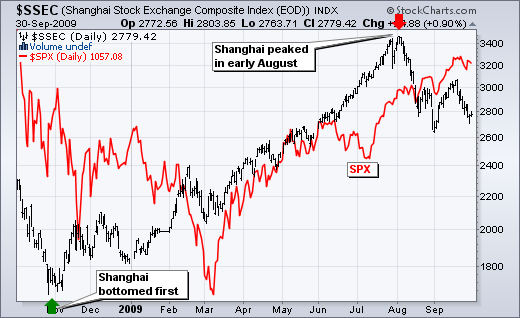
Speaking of disconnents, Japan and China have disconnected from the US and Europe. The chart below shows the performance of the Shanghai Composite ($SSEC), Nikkei 225 ($NIKK), S&P 500 and three European indices. The US and European indices moved steadily higher from July to September. China peaked in early August and moved lower. Japan has been flat since mid August. The second chart shows the Shanghai Composite and the S&P 500 over the last 12 months. Notice that the Shanghai Composite bottomed well ahead of the SPX (by four months). With a peak in early August, the Shanghai Composite has been falling for two months now. I view relative weakness in China as a negative for the US stock market.
*****************************************************************
Stock Setups and Notable Moves
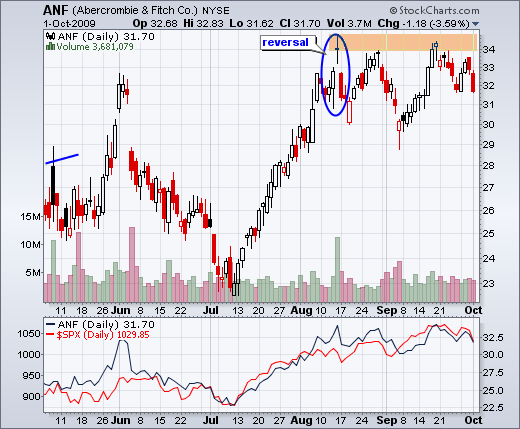
Abercrombie & Fitch (ANF) failed at resistance for the third time in two months. The stock has gone nowhere since mid August and shows relative weakness since then.
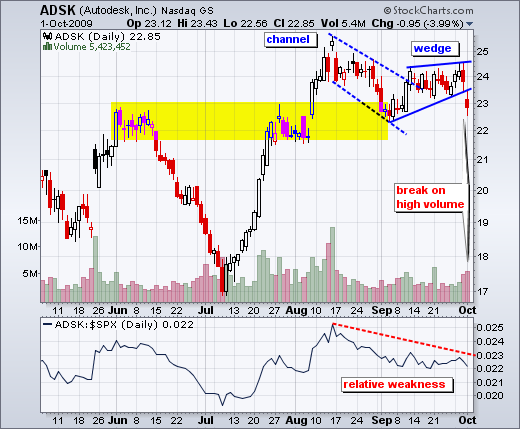
Autodesk (ADSK) broke wedge support with expanding volume. The stock also shows relative weakness as the price relative remained flat throughout September.
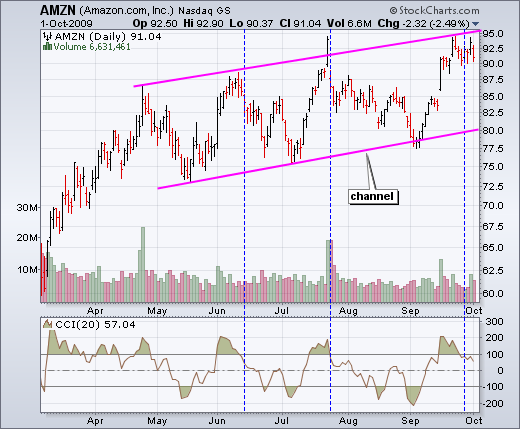
Amazon (AMZN) hit channel resistance for the fourth time in six months. Channel resistance and overbought CCI foreshadowed pullbacks in June and July. A move below 100 in CCI acts as the trigger.
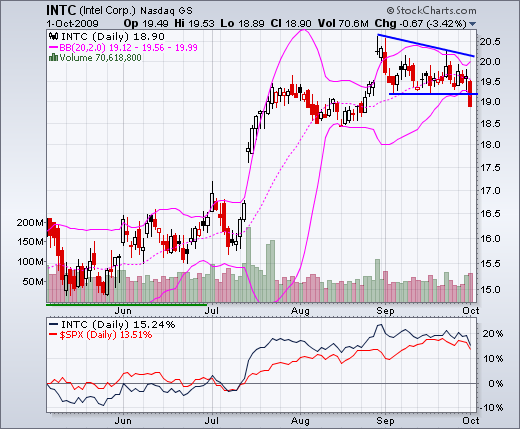
Intel (INTC) plunged below the lower Bollinger Band. After a month long consolidation and Bollinger Band tightening, Intel broke below support with a sharp decline on high volume. This bodes ill for the semis, the Nasdaq and the stock.
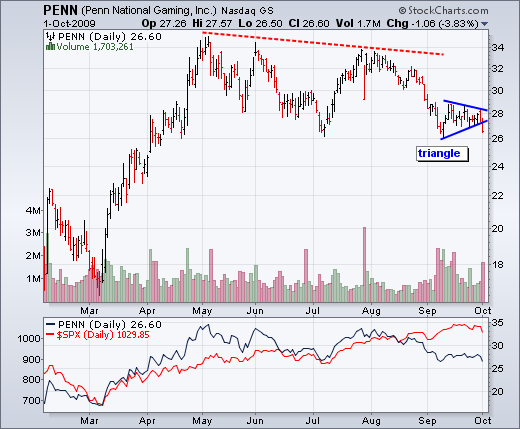
Penn National Gaming (PENN) broke triangle support with high volume. The stock also shows relative weakness.
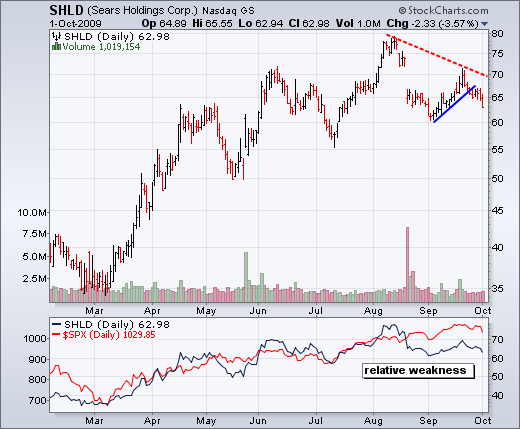
After returning to the gap with a move above 70, Sears Holdings (SHLD) peaked and broke down over the last few days. The stock also shows relative weakness since mid August.
*****************************************************************
Thanks for tuning in and have a great weekend!
*****************************************************************

