-SPY Zigzags After July Surge
-SPY Stochastic is Short-term Overbought
-Stocks and Dollar Do Inverse Dance
-Oil Fails to Capitalize on Dollar Weakness
-XLE and OIH Hit Resistance Zones
-XOM Forms Triangle with Relative Weakness
-Falling Agriculture Prices Could Affect ADM
-Stocks: BG, GENZ, IMN, LMT and MOS
-Click here for today's video.
-Next update: September 19th (Friday) around 7AM ET.
************************************
*****************************
Doing the Zigzag
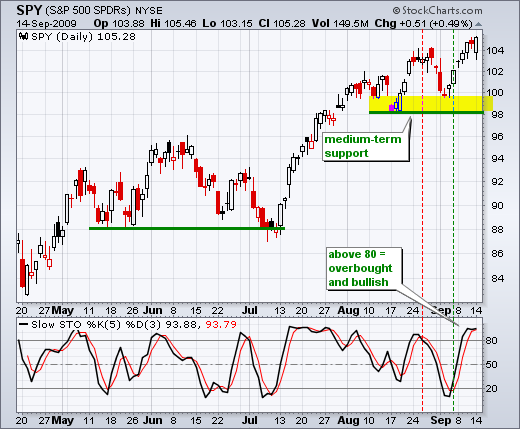
After a weak opening on Monday morning, stocks rallied throughout the day and most major index ETFs closed above last week's highs. New reaction highs keep the medium-term UP trend firmly in place. The overall gain on Monday was rather modest. Regardless, there is no questioning the medium-term uptrend. The August-September lows mark medium-term support for the S&P 500 ETF (SPY), Nasdaq 100 ETF (QQQQ) and Russell 2000 ETF (IWM).
The latest advance started with a sharp surge in July. Since the initial surge, the major index ETFs have been zigzagging higher in August and September. It is not unusual to see a zigzag after a sharp advance. In such situations, I think that a bound momentum indicator like the Slow Stochastic Oscillator is appropriate for short-term signals. As a momentum oscillator, this indicator will not work so well in a trending market. However, the current zigzag advance has characteristics similar to a trading range. Momentum indicators like the Stochastic Oscillator are well suited for trading ranges. At this point, the Stochastic Oscillator is trading above 80, which is both overbought and bullish. A move below the signal line AND below 80 would be short-term negative. Top picking is a dangerous game, but this Stochastic cross would be one of the first signals to watch.
*****************************************************************
Stocks Up Dollar Down
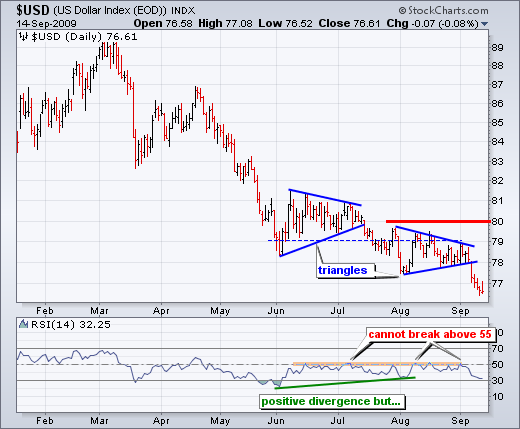
It is an old theme right now, but it continues to work. The Dollar was down on Monday and stocks were up. The US Dollar Index ($USD) has declined 6 days straight, while SPY is up 6 of the last 7 days. On a fundamental basis, a falling Dollar is positive for the economy because it makes exports more competitive. However, I would not go as far as to say weakness in the Dollar is causing strength in the stock market (or visa versa). In any case, there is no denying the current inverse relationship and I will be watching the Dollar closely as long as this relationship holds. An upturn in the Dollar would reinforce a downturn in stocks. It ain't happened yet though.
*****************************************************************
Oil Fails to Capitalize on Weak Dollar
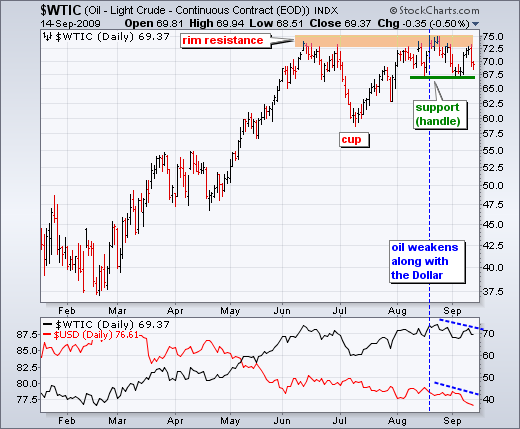
Despite further weakness in the Dollar over the last few weeks, West Texas Intermediate ($WTIC) did not break above its summer highs and fell rather sharply on Friday. Something is not right here. Oil is showing weakness when it should be showing strength. After all, the Dollar is hitting new lows and the stock market is hitting new highs. With this discrepancy, there could be trouble ahead for black gold. On the price chart, I must admit that the current pattern looks like a cup-with-handle, which is a bullish continuation pattern. A break above 75 would be bullish and argue for further strength into the 80s. However, with oil acting rather strange, a break below handle support would be bearish and the possibility of a double top would emerge. The June-August highs mark the two higher and the July low marks double top support.
*****************************************************************
XLE and OIH Hit Resistance
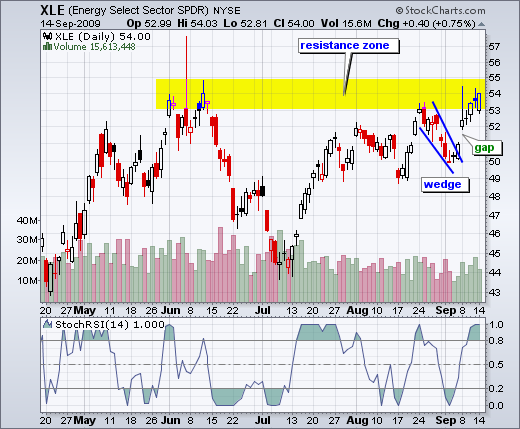
With oil showing relative weakness, we should also keep an eye on the Energy SPDR (XLE) and the Oil Service HOLDRs (OIH). XLE is hitting resistance from the June highs after a seven day advance. The ETF formed a spinning top candlestick on Friday and then a white candlestick with Monday's recovery. Despite resistance, XLE remains bullish at this stage. The bottom indicator window shows StochRSI (14). This is the Stochastic Oscillator applied to 14-day RSI. In a nutshell, it is RSI on steroids. Watch for a move below the centerline (.50) to show the first sign of weakening momentum.
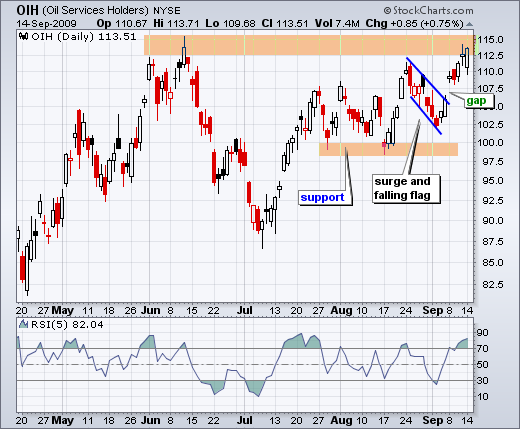
OIH is also trading near resistance from its June highs. The ETF broke falling flag resistance with a gap last week and held the breakout all week. As with XLE, OIH remains in bull mode currently. The bottom indicator shows RSI (5) above 70, which is both short-term overbought AND bullish. Watch for a move below 70 to show weakening momentum.
*****************************************************************
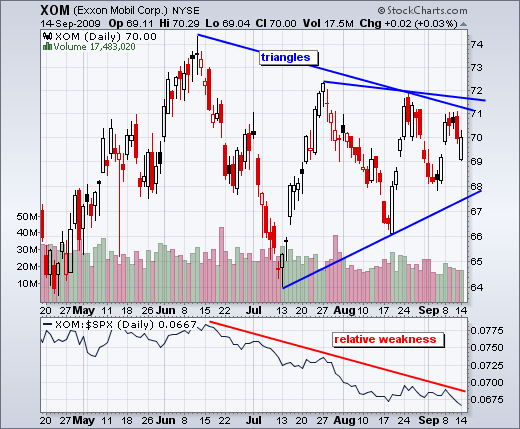
XOM extends consolidation. As the biggest component in XLE, the direction of the break in Exxon Mobil (XOM) will be a big influence. XOM has been one choppy stock the last four months and the range narrowed over the last two months. A move above 72 would break triangle resistance and be bullish. With the stock currently showing relative weakness and lots of resistance in the low 70s, the bears currently have the upper hand.
*****************************************************************
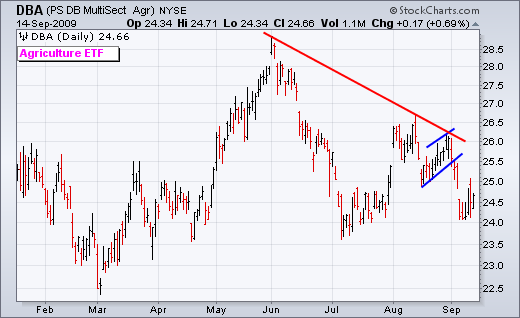
Weakness in agriculture prices could affect Archer Daniels Midland (ADM). The Agriculture PowerShares (DBA) has been one of the weakest commodities related ETFs over the last few months. A lower high formed in August and the ETF broke flag support in September.
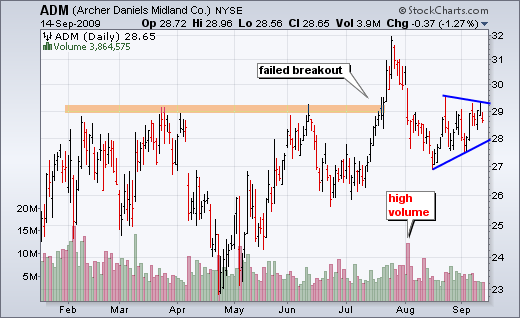
With a high volume decline below 28 in August, ADM failed to hold its July breakout. The stock then formed a triangle consolidation the last few weeks with resistance around 29. Notice that this was the resistance zone prior to the July breakout. ADM looks vulnerable near this resistance zone.
*****************************************************************
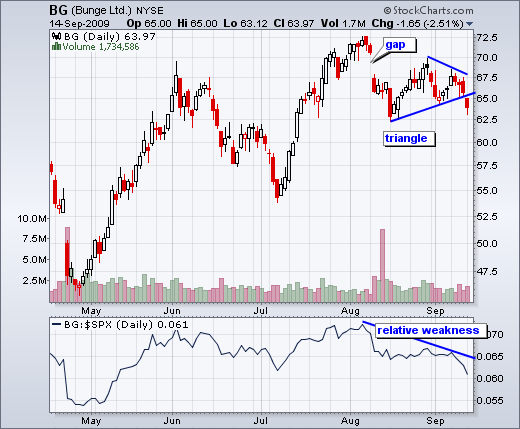
Speaking of agriculture related stocks, Bunge (BG) shows relative weakness with a triangle break on Monday.
*****************************************************************
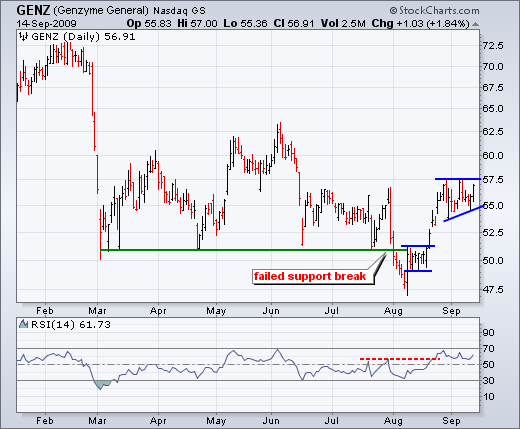
Genzyme (GENZ) formed a head-and-shoulders pattern from March to July and even broke neckline support in early August. However, this support break did not hold long. The stock bounced back above 50 with a big move, consolidated for a few days and then surged above 52.5. Another consolidation formed the last two weeks and a move above 57.5 would break resistance.
*****************************************************************
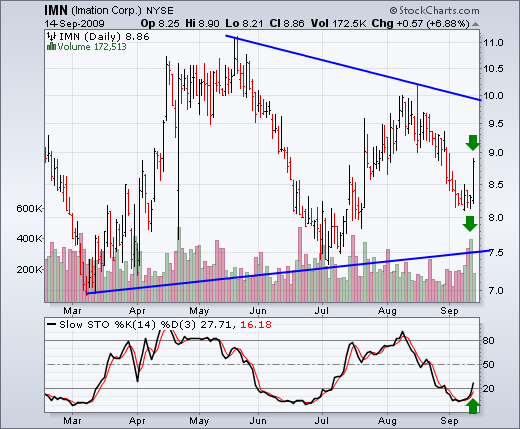
Imation (IMN) springs back to life. The technology sector has been moving higher since March, but disk drive maker Imation has not kept pace. The stock has been range bound with a large triangle taking shape the last 7-8 months. With a big surge on big volume Friday, a higher low is taking shape and this could setup a resistance challenge around 10. The bottom indicator window shows the Stochastic Oscillator turning up and moving above 20.
*****************************************************************
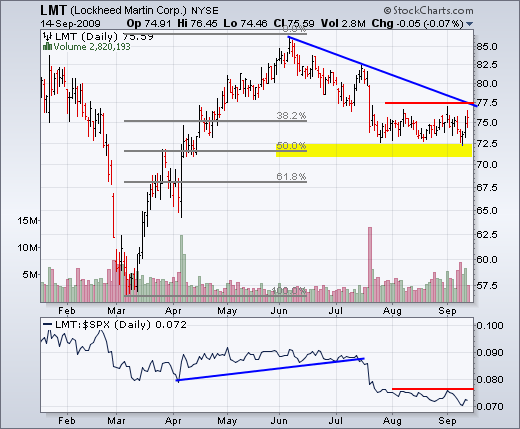
Lockheed Martin (LMT) bounces off key retracement. I have had a bearish bias for LMT the last few weeks, but the stock did not break down and is now starting to show some signs of strength. Maybe it's time for a reassessment. LMT retraced 50% of the prior advance with the decline to 72.5. The stock firmed from late July until September and bounced with good volume late last week. A breakout at 77.5 would be bullish.
*****************************************************************
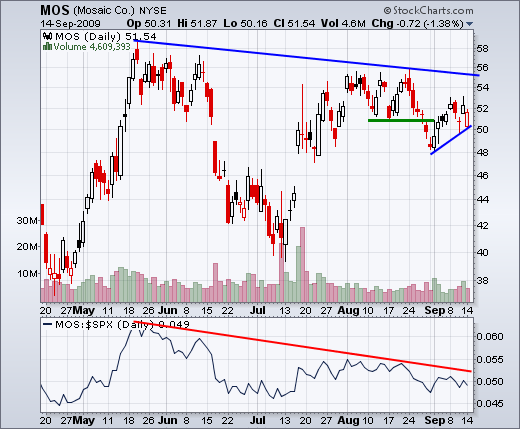
Mosaic (MOS) recovers after support break. MOS formed a lower high in August and broke support in late August. After this support break, the stock rebounded somewhat with a move above 52. However, this move looks like an oversold bounce as the stock shows continued relative weakness. A break below 50 would signal a continuation of the late August decline.
*****************************************************************

