- Stocks remain medium-term bullish
- Short-term overbought conditions persist
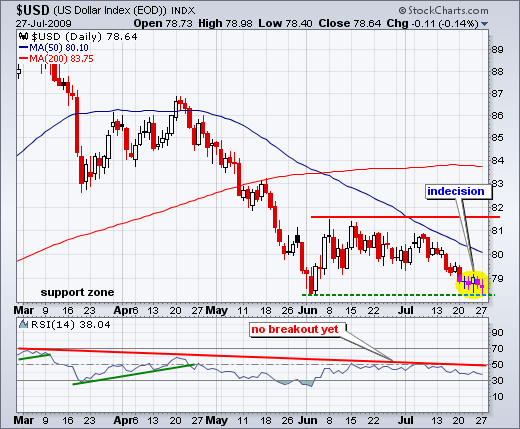
- Dollar firms near June low
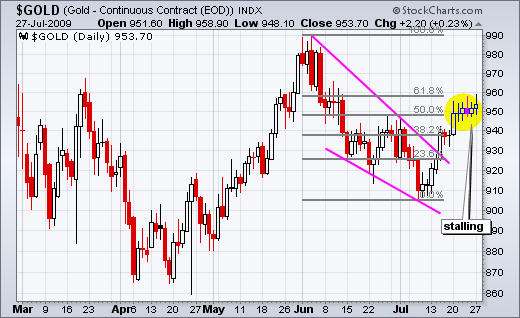
- Gold stalls at retracement
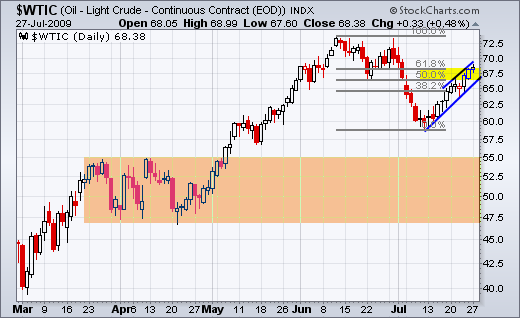
- Oil forms rising wedge
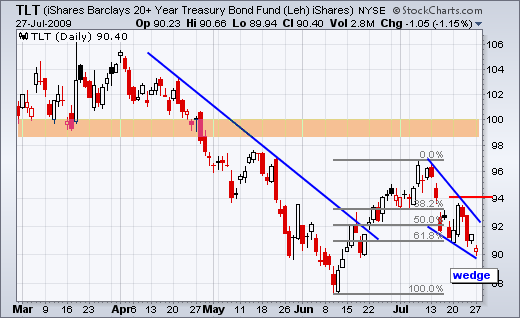
- TLT forms narrow range days.
- Link to today's video.
- Charts Worth Watching will be posted around9:30AM.
- Next update will be Friday (July 31) by 7AM ET.
*****************************************************************
Stock Market Overview
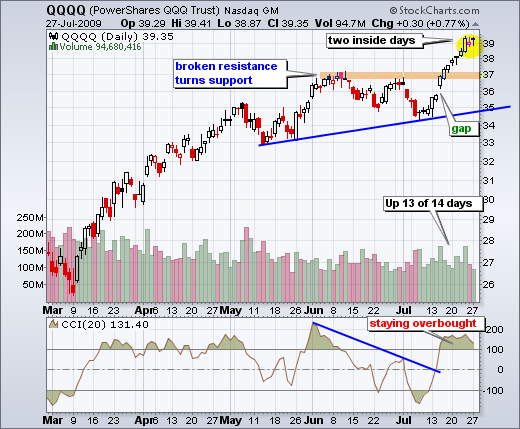
The bulk of the medium-term evidence remains bullish. The major index ETFs broke to new reaction highs last week. Techs have been showing upside leadership and small-caps started showing leadership last week. Breadth remains strong overall. Bonds and the Dollar remain weak, which benefits stocks. In addition, oil and gold have been following the stock market higher the last 2-3 weeks. Stock market momentum is medium-term bullish, but still short-term overbought. In addition, QQQQ and the Nasdaq are up 13 of the last 14 days. Even though this is a clear testament to underlying strength, it also exasperates overbought conditions and increases the odds for a pullback. It should also be noted that over 80% of NYSE stocks are above their 200-day and 50-day moving averages. These indicators also reflect overbought conditions. I will provide a full market overview on Friday. This will include charts for the major index ETFs, key stock market indicators, sector leaders/laggards, gold, oil, bonds and the Dollar.
*****************************************************************
Inside Days for QQQQ
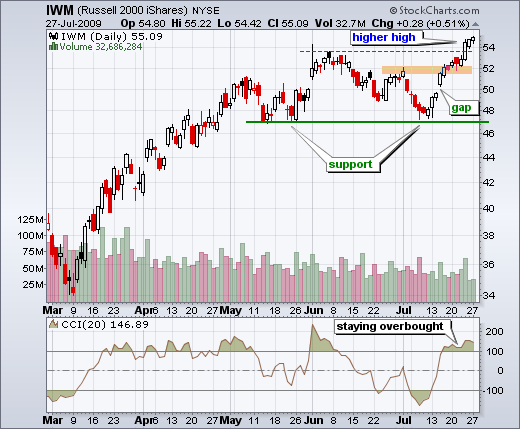
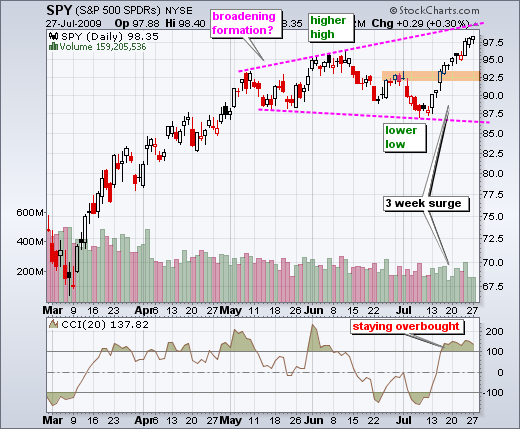
IWM and SPY edged above last week's highs on Monday, but QQQQ fell short and finished with its second inside day. With these inside days, QQQQ showed a little relative weakness over the last two days. Thursday's long white candlestick showed continue strength, but the next two inside days showed sudden indecision. This could lead to a pullback. Thursday's long white candlestick and Friday's first inside day formed a harami, which is a potentially bearish candlestick pattern. Keep in mind that candlestick patterns are short-term - meaning they are valid for just 1-2 weeks. All three ETFs are staying overbought as CCI remains above 100. This means that the overbought rally continues. A move below 100 would shows the first sign of momentum loss. As far as pullback targets, the orange areas on each chart show broken resistance levels that mark the first support to watch.
*****************************************************************
RSI Still Short-term Bullish
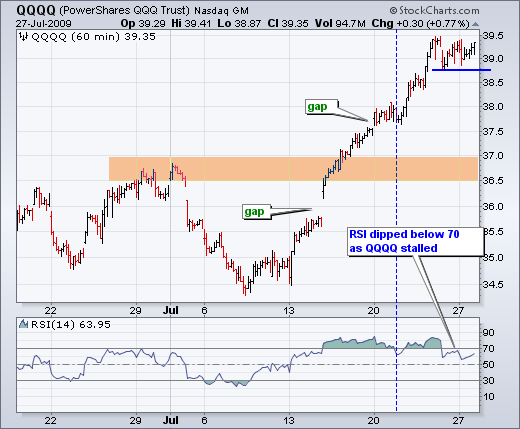
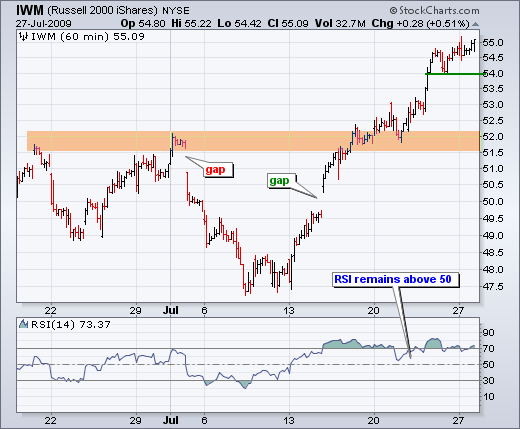
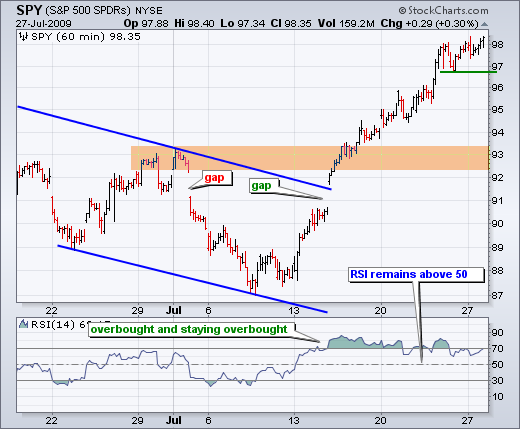
On the 60-minute charts, all three ETFs remain in clear uptrends, but all three are also way overextended. From their July lows, IWM is up over 15%, QQQQ is up over 14% and the lowly SPY is up over 12%. These are substantial moves for a full year, let alone a mere three weeks. All three charts show 14-period RSI slipping below 70 over the last two days. This means upside momentum is waning (less strong). However, upside momentum is still stronger than downside momentum. 50 is the line-in-the-sand for RSI. The trend is generally up when RSI is above 50 and down when RSI is below 50. A break below 50 would argue for a short-term downtrend. This would translate into a pullback on the daily charts. Again, the orange areas mark broken resistance zones that turn into the first support zones to watch.
*****************************************************************
Inter-Market Turns Real Quiet
Trading is getting real quiet in gold, oil, bonds and the Dollar. Is this the calm before the storm? Periods of low volatility and narrow ranges are often followed by a period of increasing volatility and wider rangers. Put another way: low volatility often gives way to a significant move. Let's start with the US Dollar Index ($USD). Even though the trend remains down, the index is firming near the June low. Since a long red candlestick six days ago, the index formed five indecisive candlesticks in a row. Such stalling after a rather sharp decline could give way to a bounce. A move above the five day high would be short-term bullish and argue for an assault on the June highs, which mark medium-term resistance that defines the bigger downtrend.
The Gold-Continuous Contract ($GOLD) surged six days ago and then stalled the last five days. Look's like gold may take its cue from the greenback. The wedge breakout is still bullish, but gold is stalling near its 62% retracement mark. A break below the five day low would be short-term bearish and argue for at least a pullback. There is a lot of support around 930-940. As a strong breakout should hold, I would become concerned if gold moves below 925.
West Texas Intermediate ($WTIC) is also hitting its 62% retracement with a rising channel or wedge. Oil plunged in early July, but recovered as the stock market surged the last 2-3 weeks. A falling Dollar also assisted oil. As long as stocks remain strong and the Dollar weak, oil and gold should continue to find a bid. However, weakness in stocks and/or strength in the Dollar would be negative for gold and oil. Therefore, I am watching oil closely as it stalls near this key retracement. A wedge break would signal a continuation of the early July decline and target further weakness towards the big support zone.
The 20+ Year Treasury ETF (TLT) chart looks like an inverted chart of oil. TLT formed a falling wedge over the last 2-3 weeks. Money moved out of bonds and into stocks over this period. Even though TLT overshot its 62% retracement mark, trading turned real quiet with narrow range days on Friday and Monday. A narrow range refers to the high-low range. Look at how small the last two candlesticks are. A wedge breakout would reverse the 2-3 week decline and argue for a continuation of the June surge. This would target a move towards the 99-100 area. Such a move in bonds would likely happen at the expense of stocks. Not too fast though. TLT has yet break resistance or even surge.
*****************************************************************

