- Market Overview: SPY, GS, XLF, KRE, VIX, VXN, $NYA200R, $NAA200R
- Link to today's video.
A stock setups commentary and video will be posted around 9AM. The next update will be Friday (July 17) by 9AM ET.
*****************************************************************
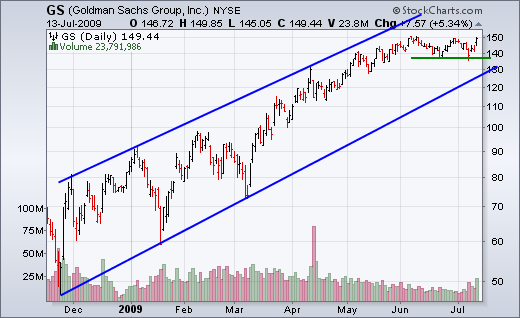
As most of us know, an upgrade of Goldman Sach (GS) spurred a big rally on Wall Street. Goldman is due to report earnings before the opening bell on Tuesday. The company will probably beat, but this is hardly surprising after looking at the chart. GS doubled in price with the March-June advance. It appears that investors have already priced in excellent earnings. We could even see a buy-the-rumor (good earnings) and sell-the-news scenario (profit taking after the announcement). While the S&P 500 slipped in June and early July, GS held relatively firm by remaining above its June low (on a closing basis). The stock continues to show relative strength. Despite an uptrend and relative strength, also keep in mind that GS has not had a decent correction since early March. Even the strong need to rest sometimes.
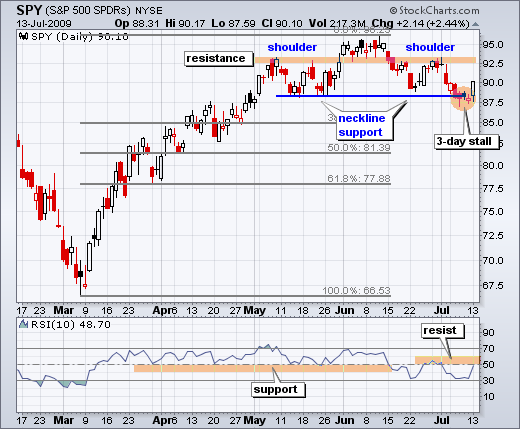
Leadership from the finance sector pushed the S&P 500 ETF (SPY) back above its neckline support break. With Monday's rebound, we may have a classic head-fake or failed signal in the works. As noted last week, failed signals are sometimes as good as signals. First, let's look at some technical reasons for Monday's rally. Using SPY as an example, we can see that the ETF declined sharply the first week of July (4-5%) and then stalled around neckline support for three days. This represented a 3-day volatility contraction. From Bollinger Bands, we know that volatility contractions often lead to volatility expansions or big moves. In addition to this volatility contraction, SPY was still trading close to support and was short-term oversold after the prior decline (92.5 to 88 in four days). The ingredients were present for at least a short-term bounce, which we got on Monday.
Now what? On the daily chart, I am watching 10-period RSI as it enters its resistance zone around 50-60. With the 40-50 zone acting as support in an uptrend, I would expect the 50-60 zone to act as resistance in a downtrend. If a downtrend is indeed underway, then momentum resistance is close. On the 60-minute chart, SPY remains within a falling price channel. With lower lows and lower highs over the last four weeks, a short-term downtrend is currently in progress. The upper trendline, the early July gap and the highs around 93 mark a resistance zone to watch (yellow area). So far, Monday's rally looks like an oversold bounce within a four week downtrend. Follow through and a breakout are needed to make this more than an oversold bounce. 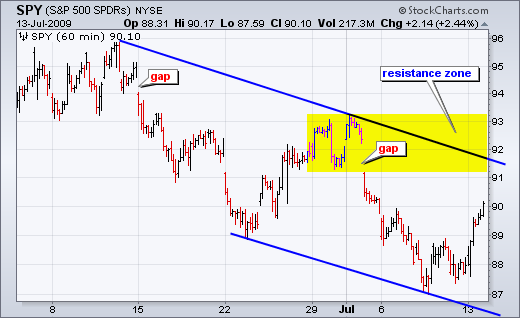
*****************************************************************
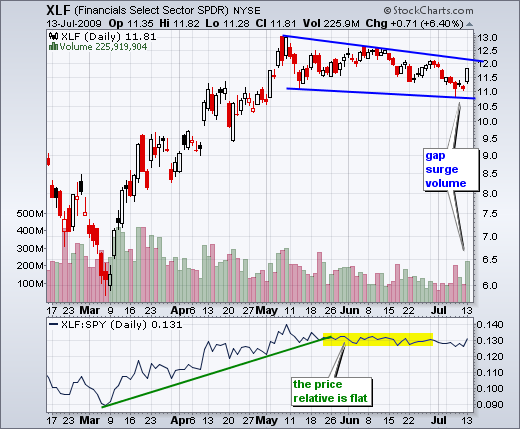
XLF surges with good volume. After surging from early March to early May, the Financials SPDR (XLF) corrected with a falling wedge over the last two months. It was a long drawn out correction. Technically, the medium-term trend remains down as long as XLF trades below the upper trendline and the late June high. Short-term, the gap and high-volume surge are bullish. For the bulls to maintain their edge, the bulk of this surge should hold. A move back below 11.5 would show hesitancy and a break below 11 would totally negate Monday's move. Keep in mind that Bank of America, Citigroup, JP Morgan, BB&T, General Electric and Prosperity Bancshares all report earnings this week.
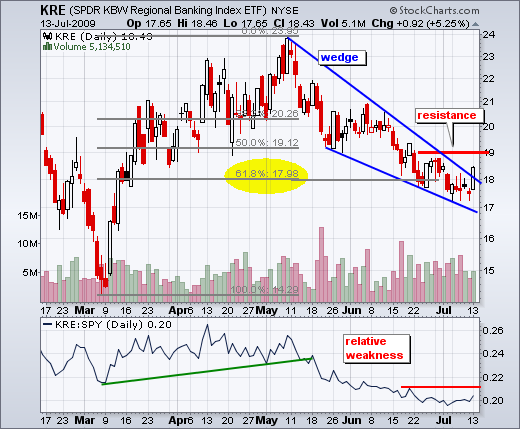
I featured the Regional Bank SPDR (KRE) in Thursday's market message as it consolidated near a potential reversal zone. Notice that the ETF retraced around 62% of the prior advance and formed a falling wedge. KRE broke above the wedge trendline with Monday's surge, but remains below key resistance at 19. The bottom picking play is here, but the trend following play requires follow through with a breakout. I was not impressed with volume on yesterday's surge and would like to see follow through to confirm Monday's move.
*****************************************************************
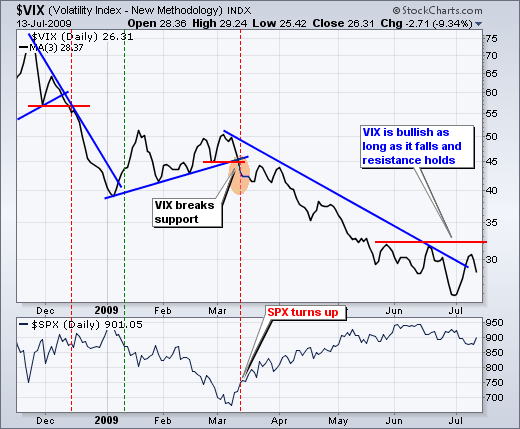
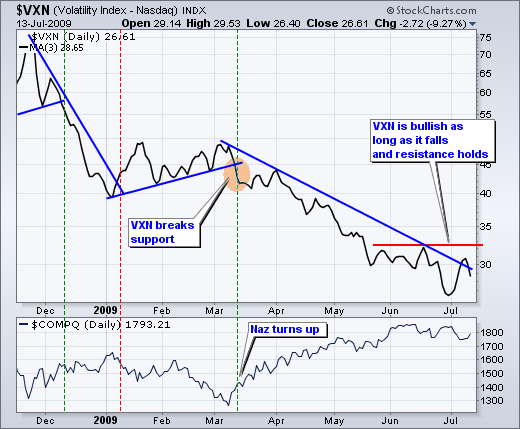
The S&P 500 Volatility Index ($VIX) and Nasdaq 100 Volatility Index ($VXN) continue to trend lower. Decreasing volatility is bullish for stocks. There was a surge in early July, but both 3-day SMAs remain below resistance levels put forth in early July. A break above these resistance levels would show an increase in volatility, which would be bearish for stocks.
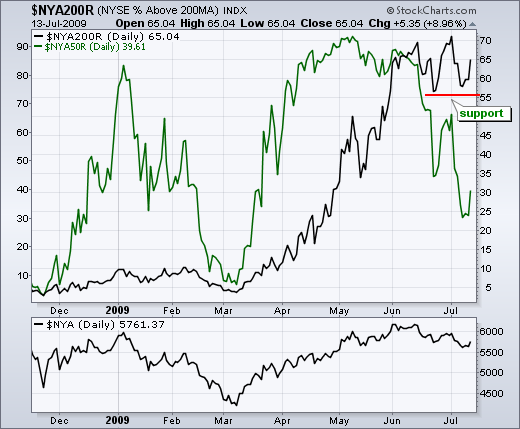
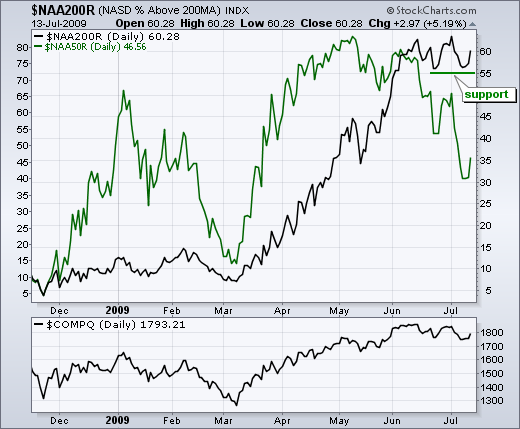
The next charts shows the number of stocks above their 50-day moving average (green line/left scale) and the number of stocks above their 200-day moving average (black line/right scale) The number of stocks trading above their 50-day moving average fell sharply over the last two months. The indicator bounced with Monday's surge, but remains in a downtrend. The number of stocks trading above their 200-day moving averages has remained above 55% since early June. In fact, there is a support level at the 55% mark that warrants our attention. Technically, the bulls have the edge as long as 55% of stocks remain above their 200-day moving averages. This makes sense. A move below this support would show deteriorating breadth and would be negative for the market.
*****************************************************************

