- Charts Worth Watching: AEP, BDK, BMY, CNP, DIA, DKS, DUK, ENR, HD, IWM, IWM, JPM, KRE, LLY, LOW, PFE, QQQQ, RX, SO, SPY, TE, WHR, XLU, XLV, XLY
- Click here for today's video
- The next update will be Tuesday (June 16) by 9AM ET.
*****************************************************************
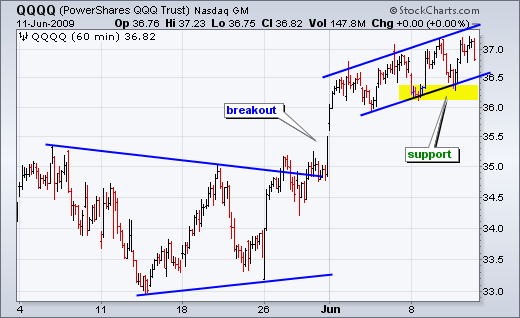
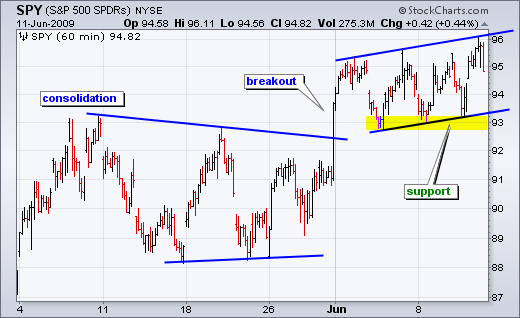
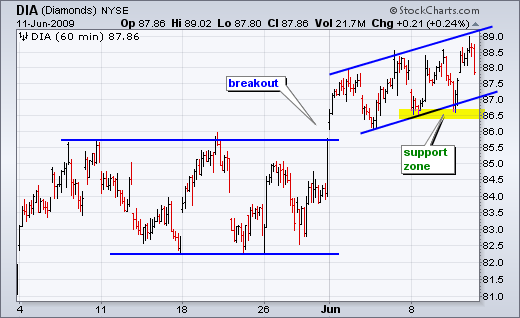
The major index ETFs remain in bull mode as the consolidation breakouts continue to hold. Since breaking consolidation resistance, the S&P 500 ETF (SPY), Dow Diamonds (DIA) and Nasdaq 100 ETF (QQQQ) have been working their way higher with rising channels in June. These channels define the two week uptrend with higher highs and higher lows. Therefore, by definition, the short-term trend is up as long as these channels hold. A break below the lower trendline and the last reaction low (support zone) would reverse this short-term uptrend. Despite medium-term overbought conditions, relative weakenss in some key groups and rising interest rates, the bulls rule these charts right now.
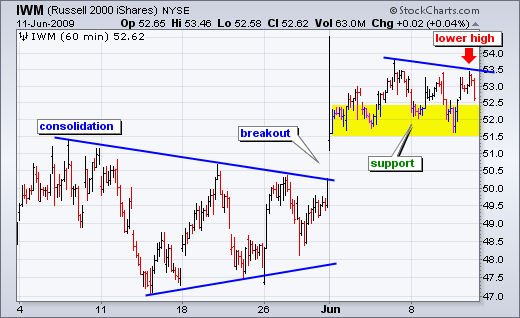
I did not show the Russell 2000 ETF (IWM) with this group because this ETF is actually lagging the other three. Instead of a rising price channel, IWM has been trading flat the last two weeks. This shows relative weakness in small-caps, which could foreshadow a pullback or correction in the market. Small-caps are sometimes considered the canaries in the coalmine. They are the most sensitive to changes in the environment (energy prices, interest rates, economy etc...). For now, IWM is holding consolidation support around 51.5-52 (yellow area). A break below support would start a short-term downtrend.
*****************************************************************
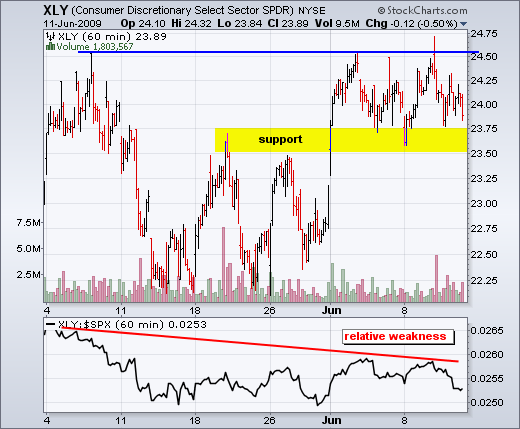
Relative weakness in the consumer discretionary remains a concern. While SPY works its way higher in June, the Consumer Discretionary SPDR (XLY) traded flat and failed to break above its May high. The price relative (XLY:$SPX ratio) remains well below its May high to reflect relative weakness. In addition, the price relative turned down late this week. On the price chart, XLY is still holding above broken resistance and this area now turns into support (yellow zone). A break below 23.50 would be bearish. As long as XLY holds support, there is a chance for an upside breakout. Watch for another move above 24.6 to trigger such a breakout. The first group of stocks come from the consumer discretionary sector. Unsurprisingly, these setups are potentially bearish with rising wedges, flags and relative weakness.
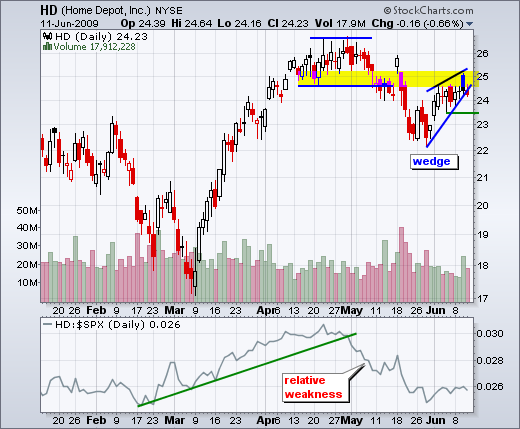
Home Depot (HD) is meeting resistance after forming a potentially bearish wedge. HD plunged in May, but rebounded in June by retracing around 62% of the May decline. This advance formed a rising wedge and the stock is meeting resistance near broken supports (yellow zone). Like the consumer discretionary sector, HD is also showing relative weakness as its price relative trades near its February lows. A break below wedge support would signal a continuation of the May decline.
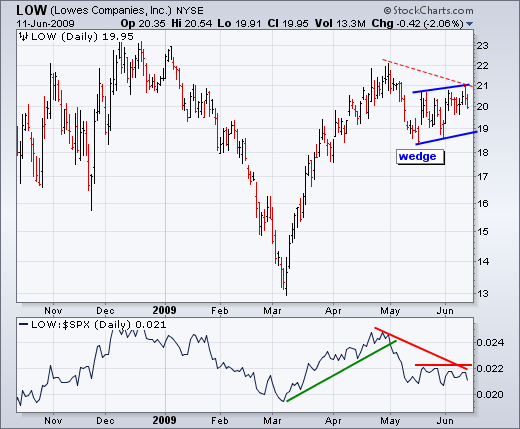
Lowes Companies (LOW) is also showing relative weakness over the last 6-7 weeks. The price relative declined in May and then consolidated the last few weeks. A break above resistance would be positive, but it has yet to actually happen. On the price chart, LOW formed a rising wedge with support around 19. A break below this level would signal a continuation of the prior decline.
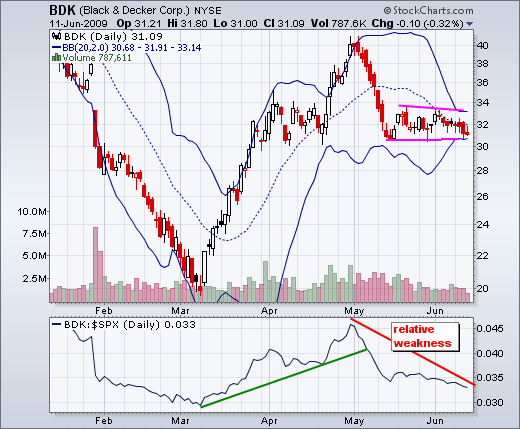
Black & Decker (BDK) was featured on Tuesday and the pattern at work remains valid. The stock declined sharply in early May and then consolidated with a tight range the last four weeks. Notice how the Bollinger Bands contracted to reflect decreasing volatility. A break below range support would be bearish, while a break above range resistance would have to be considered bullish.
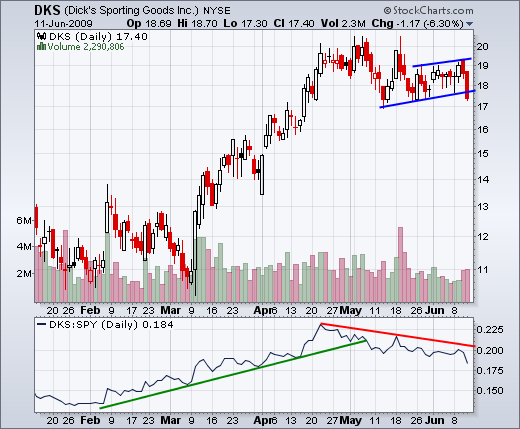
Dick's Sporting Goods (DKS) broke flag support with a sharp decline over the last two days. Notice that volume expanded as the stock broke support. The price relative peaked in April and the stock has been showing relative weakness for almost two months.
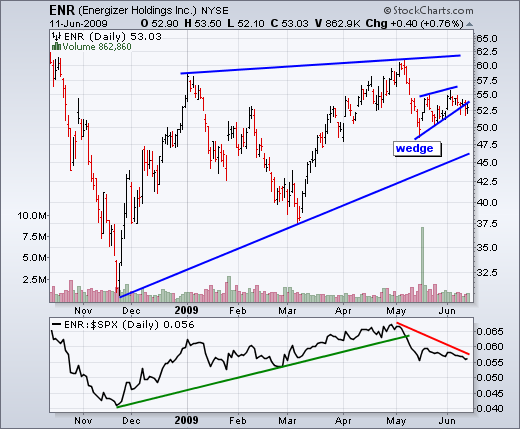
Energizer Holdings (ENR) sports a wedge within a wedge. The stock declined sharply in May and then formed a small rising wedge over the last few weeks. ENR edged below wedge support with some weakness in June. The price relative broke support in early May and has been moving lower as the stock continues to show relative weakness.
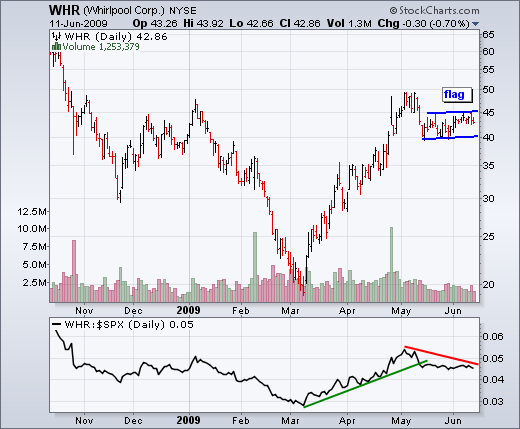
Whirlpool (WHR) hits resistance and stalls. WHR led the market higher from early March until early May with a monster advance. At the May high, the stock was up around 150% from its March lows. All this occurred without a decent correction. There was a pullback in May and then a flag consolidation formed over the last few weeks. The stock is currently trading near flag resistance (45) that marks its make or break point.
*****************************************************************
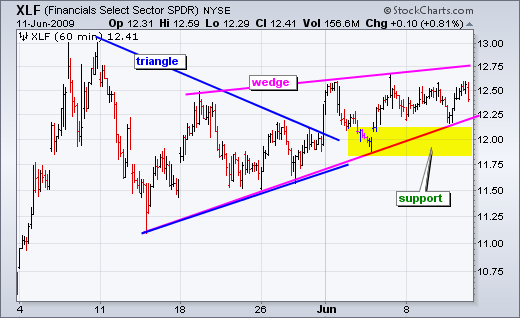
I am still keying on the Financials SPDR (XLF) and the Regional Bank SPDR (KRE) for signs from the finance sector, which could in turn affect the overall market. XLF remains with a rising wedge uptrend over the last four weeks. The top of the wedge shows stiff resistance around 12.5 as the ETF has trouble holding this level. Even so, the wedge is still rising and this means the trend is up. Look for a break below the yellow support zone to reverse this short-term uptrend.
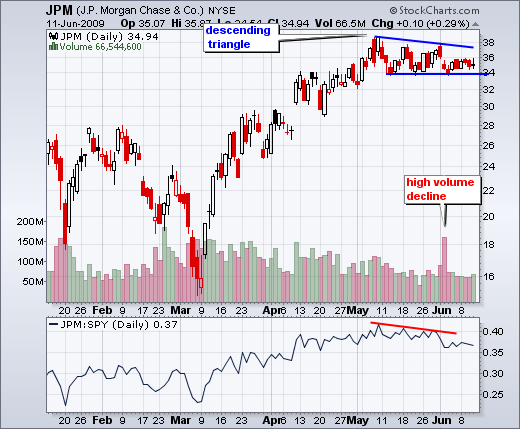
As the single biggest component in XLF, JP Morgan Chase (JPM) is the one to watch for directional clues. JPM is holding support for now, but showing relative weakness over the last few weeks. The price relative (JPM:$SPX ratio) peaked in early May and moved lower in June. On the price chart, the stock remains within a descending triangle forming. JPM also gapped down the first week of June and this gap is holding. A break below 34 would confirm the descending triangle and argue for a correction of the March-May advance.
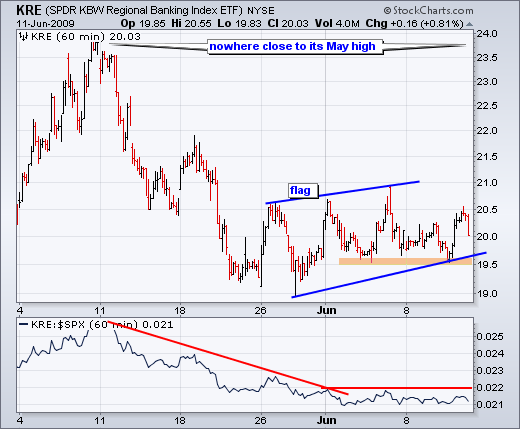
The Regional Bank SPDR (KRE) remains with a bearish flag over the last few weeks. After a sharp decline in May, the stock firmed in June with a trading range around 19-21. I am marking flag support at 19.5 and a break below this level would signal a continuation lower for KRE.
*****************************************************************
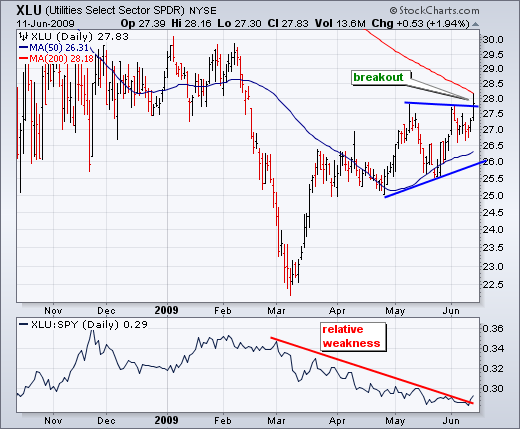
Utilities sprang to life on Thursday as the Utilities SPDR (XLU) surged above its May high. The ETF has been lagging the broader market since the March surge as the price relative moved lower over the last three months. Yesterday's surge in XLU also pushed the price relative above its March trendline. This is a good start. While relative strength from XLU would be good for XLU, it could be negative for the broader market because utilities represent a defensive sector that usually outperforms when the broader market is weak.
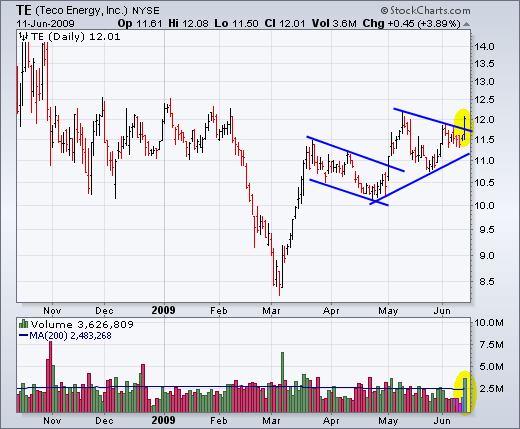
Teco Energy (TE) surged above triangle resistance with good volume on Thursday.
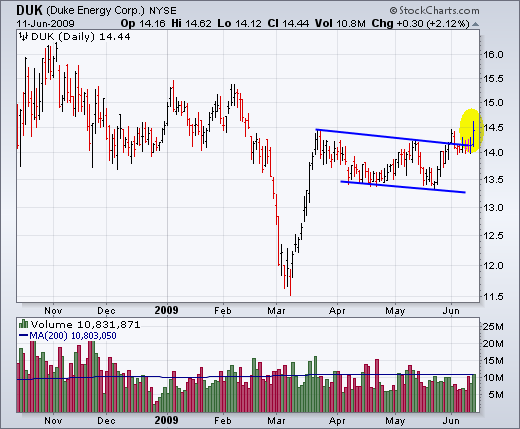
Duke Energy (DUK) broke above consolidation resistance with a surge in June.
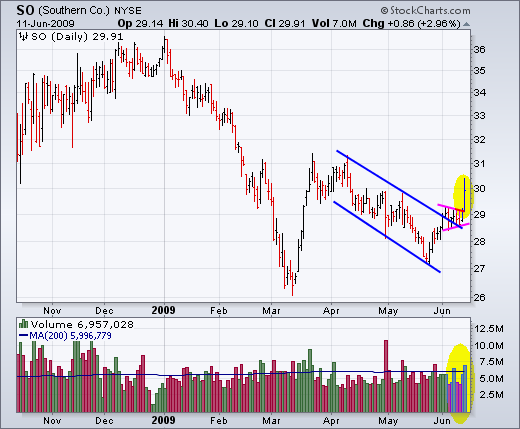
Southern Co (SO) broke channel resistance and then consolidated in early June. With yesterday's high volume surge, the stock completed the breakout.
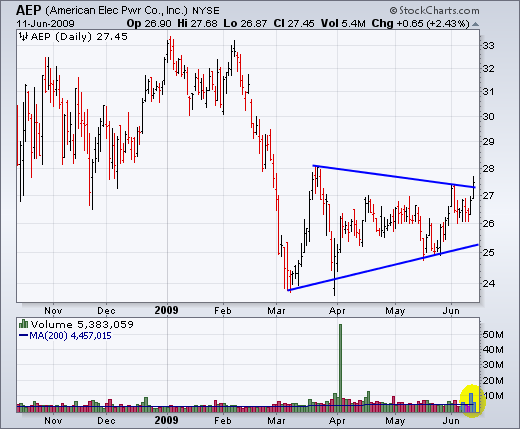
American Electric Power (AEP) broke triangle resistance with good volume over the last two days.
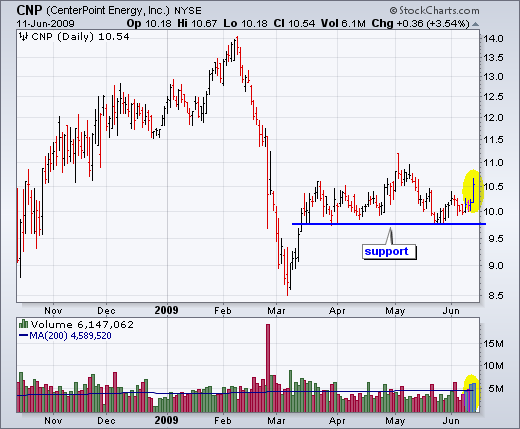
Centerpoint Energy (CNP) surged off support with above average volume.
*****************************************************************
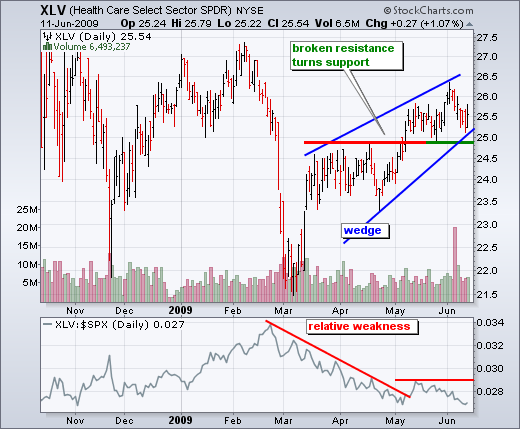
The Healthcare SPDR (XLV) showed a little life with a bounce off support on Thursday. The ETF broke resistance in early May and broken resistance turned into support. XLV surged off support at the end of May, but fell back in June with a bout of underperformance the last two weeks. Support is still holding though and it would take a move below the late May low to reverse the uptrend.
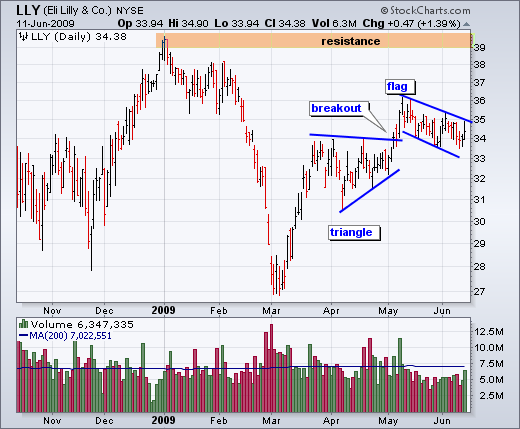
Eli Lilly (LLY) has a falling flag working with resistance at 35.
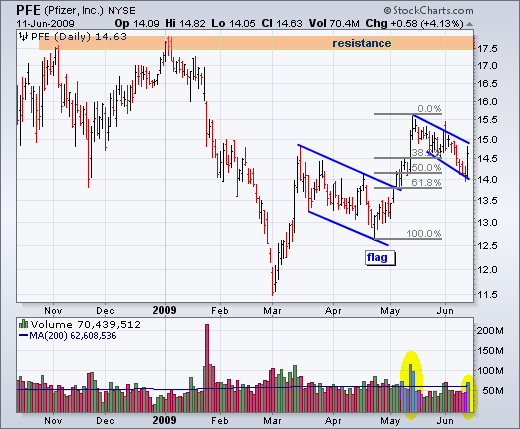
Pfizer (PFE) found support from the 50-62% retracement with a high volume bounce on Thursday. The decline since mid May did not form a perfect falling flag, but the essence of the pattern is there. In other words, it still looks like a falling consolidation with resistance at 15.
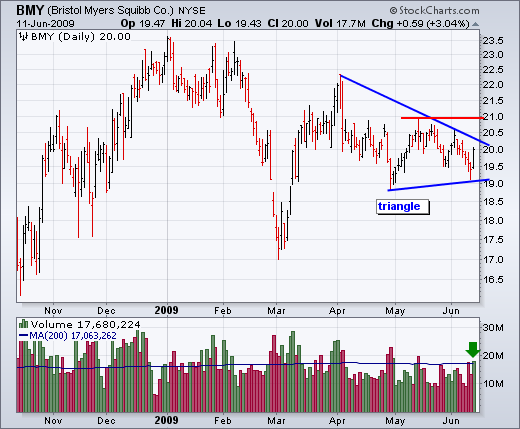
Bristol Meyers (BMY) found support at 19 and bounced with above average volume. A triangle is taking shape with resistance at 21.
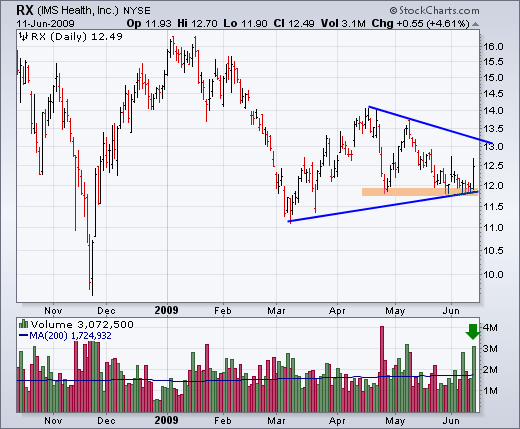
IMS Health (RX) surged off support with high volume. This is the second high volume surge in June and it reinforces support from the April-May lows.
*****************************************************************

