Charts Worth Watching: SPY, DIA, IWM, XLB, XRT AND IYT.
Another update will be posted by 12PM ET on Tuesday (26-May). This will include the stock setups and the video.
*****************************************************************
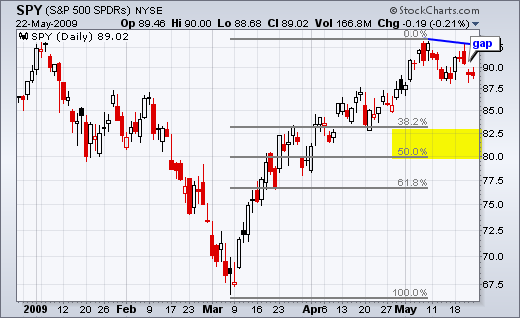
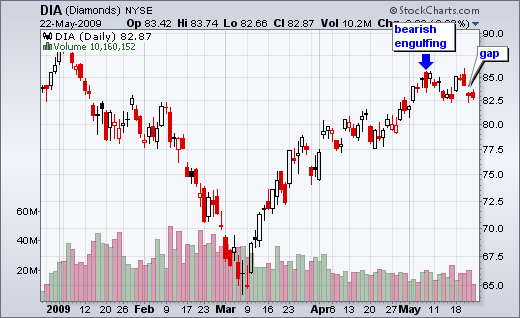
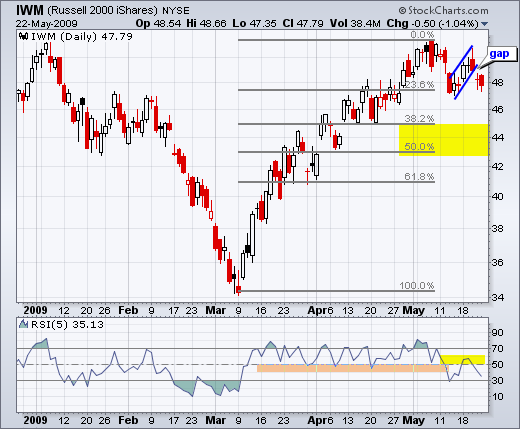
The major index ETFs are showing signs of weakness as a potential correction unfolds. These ETFs include the Dow Diamonds (DIA), the Russell 2000 ETF (IWM) and the S&P 500 ETF (SPY). First, let's back up to early May. After a big advance from early March to early May, the major index ETFs were overbought and ripe for a correction. There are two ways to correct after a sharp advance: trade flat with a consolidation or decline with a retracement of the prior advance. The SPY chart shows a sharp pullback the second week of May and then a bounce early last week. With this bounce fizzling out below the early May peak, a lower high is taking shape in SPY. This reflects a relatively weak bounce. Moreover, notice that DIA, IWM and SPY all gapped lower on Thursday – and these gaps are holding. Evidence points to further correction that could retrace 38-62% of the March-May advance.
*****************************************************************
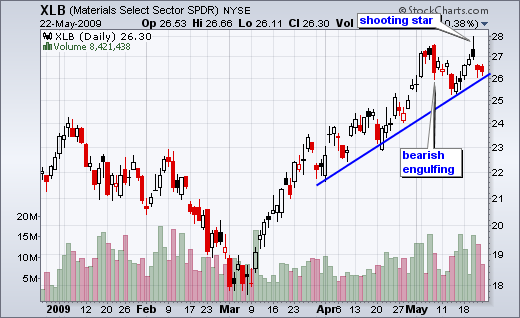
There are also signs of weakness emerging in some key sector and industry ETFs. The Materials SPDR (XLB) formed a bearish engulfing in early May. After a bounce back to resistance from the engulfing pattern, the ETF formed a shooting star and gapped down last week. XLB stalled near trendline support on Friday, but selling pressure is emerging and a trendline break would argue for a correction of the March-May advance.
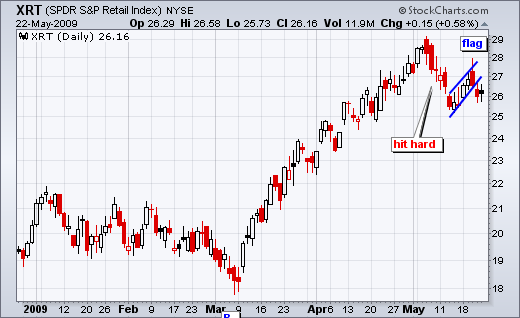
The Retail SPDR (XRT) was hit hard in early May with a sharp decline below 26. The ETF rebounded last week, but did not manage to reach its prior high. This lower high reflects a weak bounce. A bearish flag took shape and the ETF broke flag support with a gap down last Thursday. The gap and flag break are short-term bearish as long as they hold.
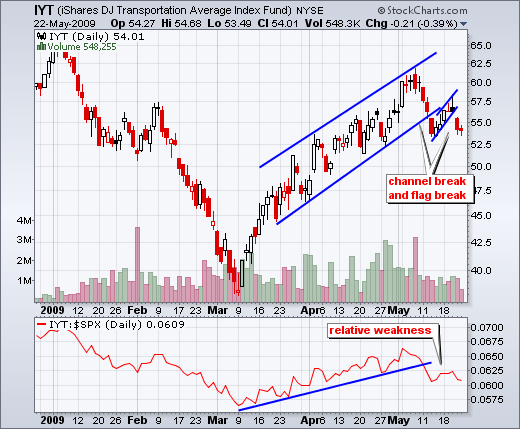
The Transport ETF (IYT) chart has characteristics similar to XRT. Notice that IYT broke channel support with a sharp decline in early May. The bounce retraced around 50% of this decline with a rising flag. IYT broke flag support with a gap down last Thursday. This signals a continuation of the early May decline. The indicator window shows the price relative breaking down over the last two weeks. IYT is showing relative weakness.
