- Charts Worth Watching: acv, amgn, amln , asei, bro,
cah, cb, eric, hon, idcc, nke, swy, trv, vrtx
- Link to corresponding video.
The next update will be Tuesday (May 26) by 11AM ET.
****************************************************************
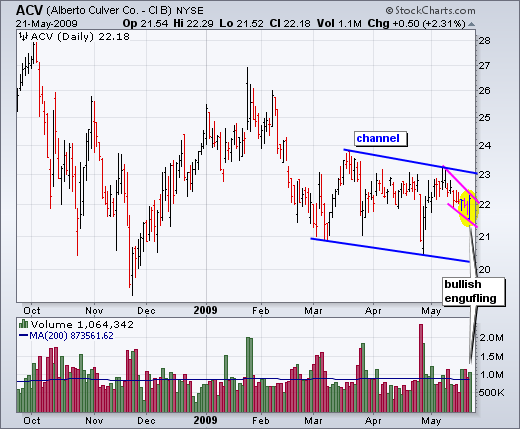
I will start off today with two potentially bullish setups from the consumer staples sector. This sector is viewed as a defensive sector that usually holds up well during periods of market weakness. Alberto Culver (ACV) has been moving lower the last few months, but a potentially bullish flag and high volume bullish engulfing could ignite a reversal. The stock surged at the end of April and then pulled back below 22 in mid May. After a weak open on Thursday, the stock moved higher throughout the day and closed near its high. This intraday reversal also occurred on above average volume. Follow through with a flag breakout would be bullish.
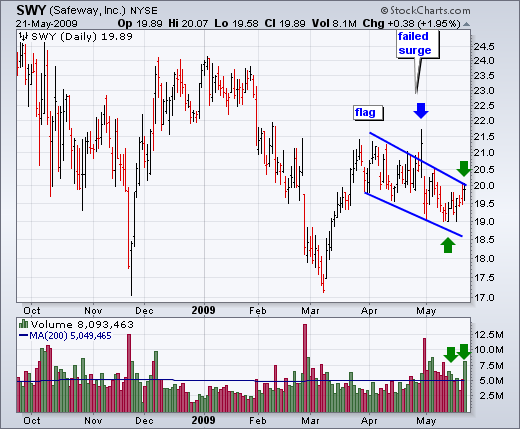
Safeway (SWY) has been featured lately and continues to come across my screens with a bullish flag. The stock surged in March and then corrected with a zigzag correction. While the market was down today, SWY surged almost 2% with above average volume. Buying interest in Safeway is picking up and a break above flag resistance would target a move towards the Dec-Jan highs.
*****************************************************************
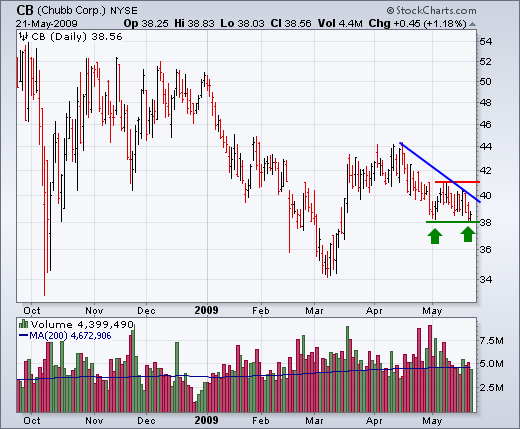
Brown & Brown (BRO) and Chubb (CB) come from the volatile finance sector, in particular the insurance industry. Chubb remains in a downtrend over the last few weeks, but the stock is finding support around 38. Even though the major stock indices were sharply lower on Thursday, CB held its ground with a 1.18% gain. Volume was below average though. Follow though holds the key here. A break above the early May high, with good volume I might add, would be bullish.
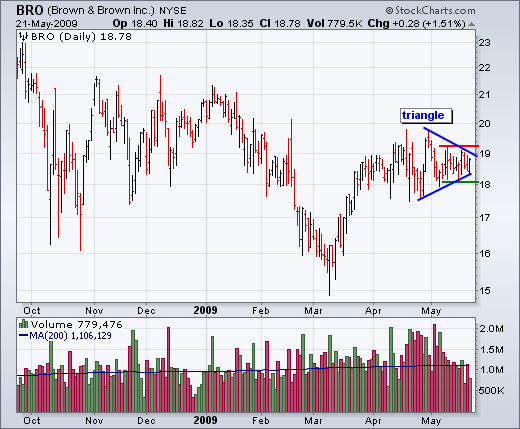
Brown & Brown surged into late March and then formed a flat consolidation the last two months. Because it traded flat the last several weeks, BRO is holding up better than CB since late April. A triangle is taking shape and I am watching the resistance boundaries for a break. A move above resistance would signal a continuation higher and target further strength towards 22sih. A break below support would call for a pullback.
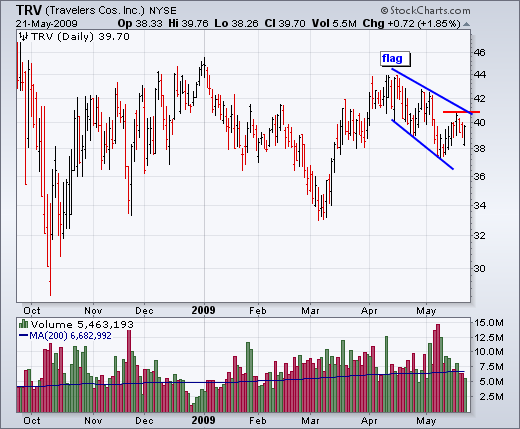
Travelers (TRV), another insurance stock, formed a potentially bullish flag over the last six weeks. The flag looks like a correction, but the correction is still going. After a weak open today, TRV recovered and closed with a pretty nice gain. Follow through above flag resistance would be bullish.
*****************************************************************
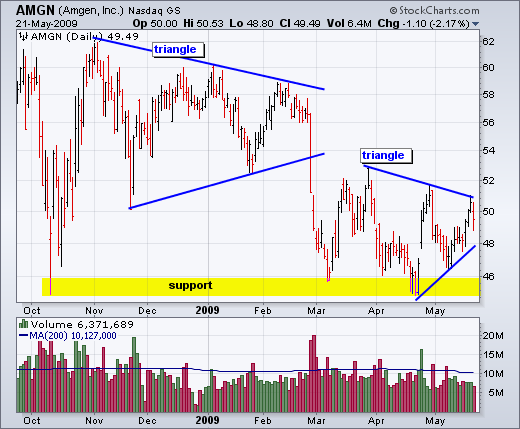
The next three stocks come from the healthcare sector. Amgen (AMGN) formed a triangle from November to February and broke down in late February. The stock found support near the October lows over the last three months. AMGN surged off this support area in late April and then pulled back in May. With a higher low forming, a triangle has taken shape over the last two months. A break from this consolidation will trigger the next signal.
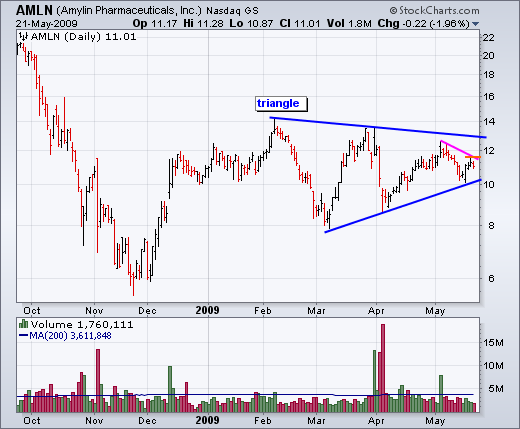
Amalyn (AMLN) formed a long triangle from February to May. After a decline in early May, the stock bounce off the lower triangle support line at 10. This bounce shows some promise, but we have yet to see follow through. A break above the pink trendline would be short-term bullish and a triangle breakout would be medium-term bullish.
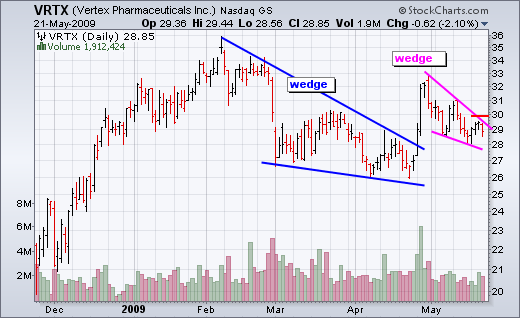
After a surge and wedge breakout in late April, Vertex (VRTX) formed another smaller wedge with a pullback over the last few weeks. This wedge still looks like a correction that will end soon, but the short-term trend is down as long as it falls. A move above 30 would break the fall and argue for a continuation higher.
*****************************************************************
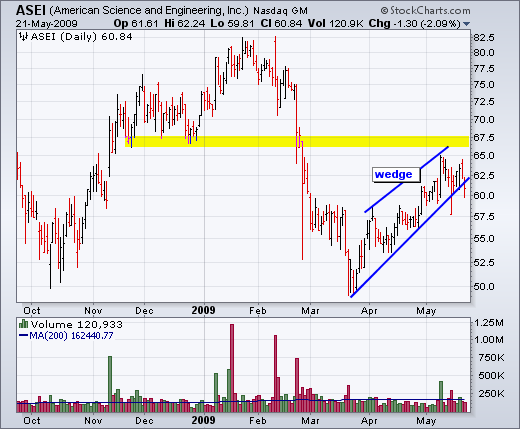
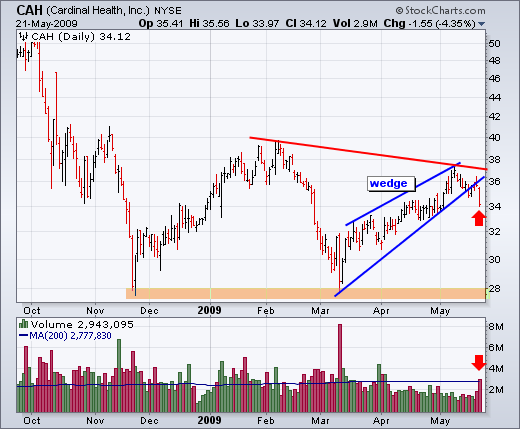
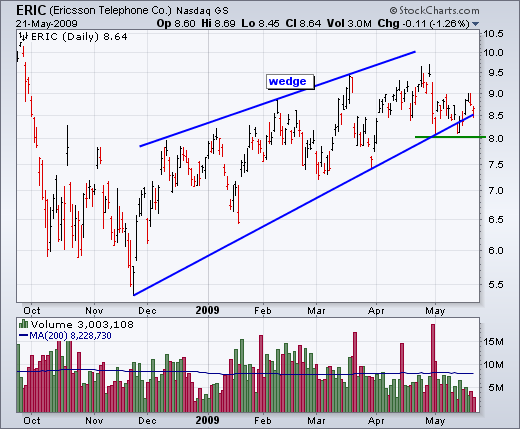
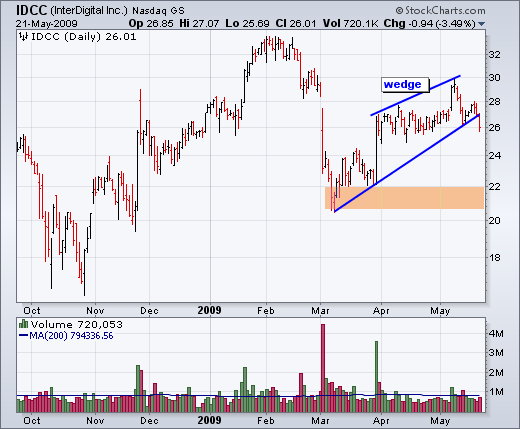
With the March-May advance there are a number of stocks, ETFs and indices with rising wedge formations over the last 2-3 months. These are corrective patterns that usually retrace a portion of the prior advance. Technically, the trend is up as long as the lower trendline holds. A break below this trendline signals a continuation of the prior decline.
*****************************************************************
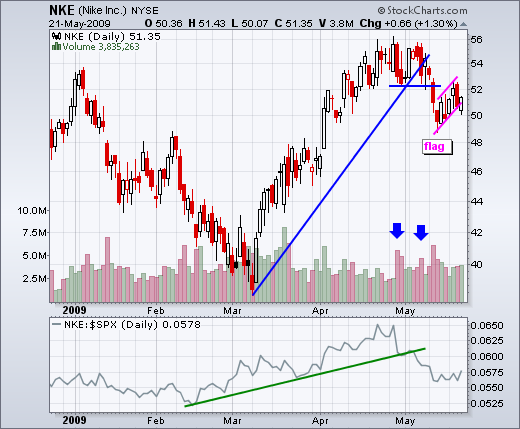
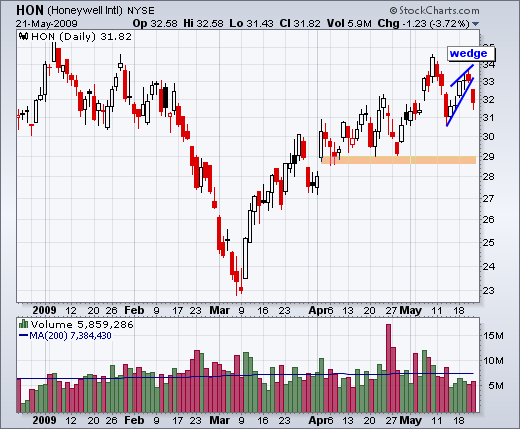
After a sharp decline in early May and small advance earlier this week, many stocks formed small rising flags or wedges. These are viewed as counter-trend moves designed to alleviate short-term oversold conditions. A break below flag/wedge support would signal a continuation of the prior decline (early May). Nike (NKE) broke flag support with Thursday's open, but rallied back above the flag trendline by the close. A break below 50 would complete the flag break and argue for lower prices. Honeywell (HON) broke wedge support with a gap down on Thursday. This gap should be considered short-term bearish as long as it remains unfilled.
